

ChartStack
Regime of divergence.

Not investment advice.
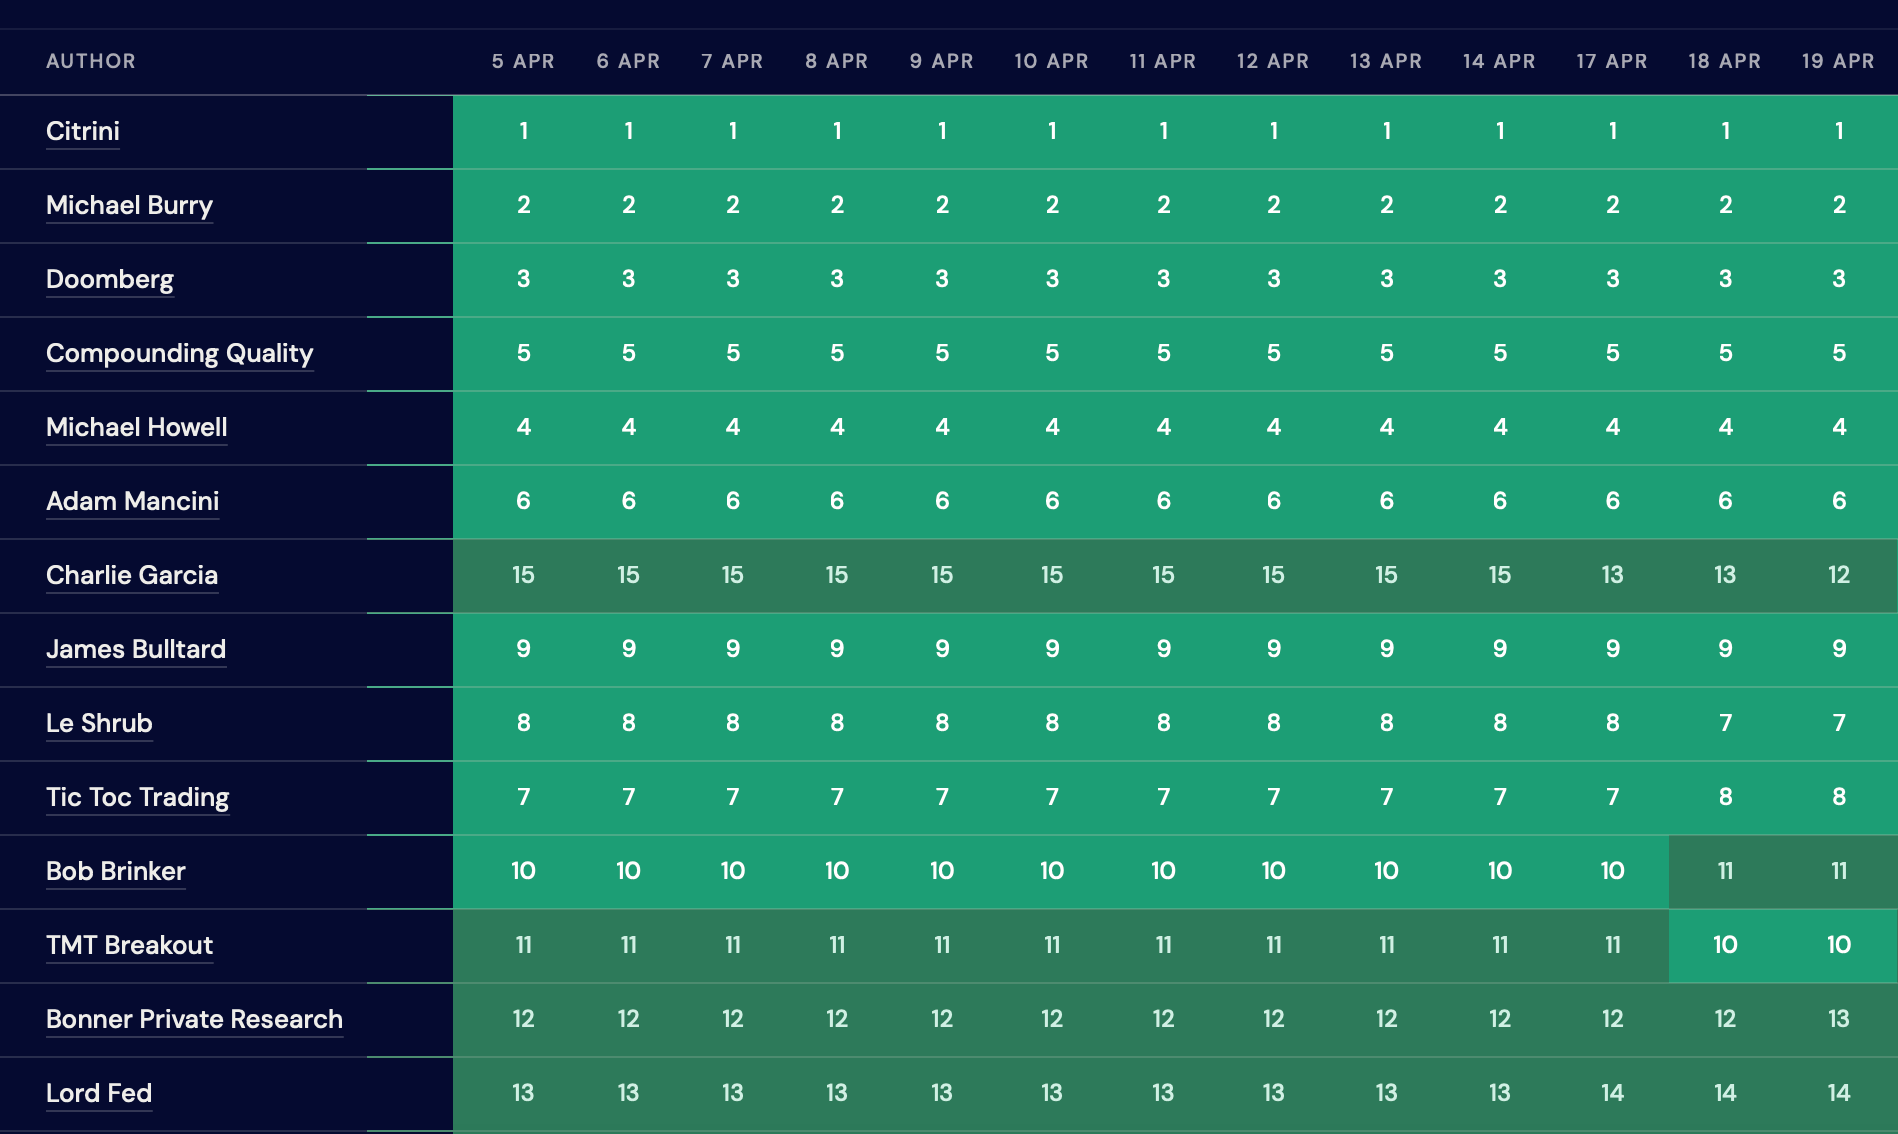
The Finance Substack Bestseller heat map reveals how structurally sticky the leaderboard is.
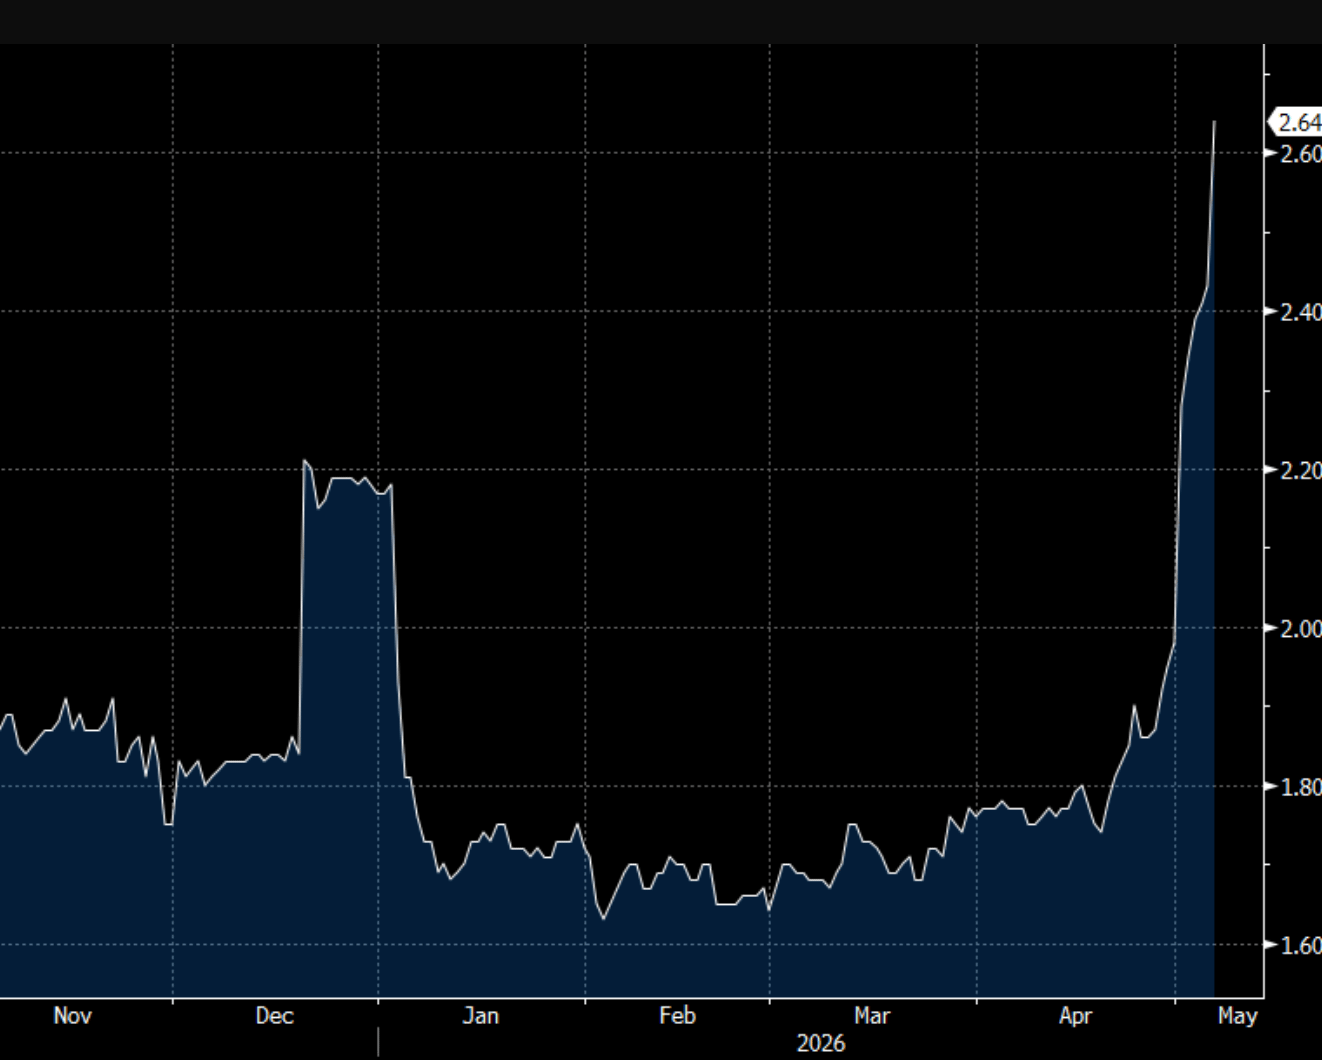
The tradeable real-time proxy for AI compute demand has gone parabolic.
Jon Turek: the Ornn Compute H100 compute index tracks the spot price of NVIDIA H100 rate.
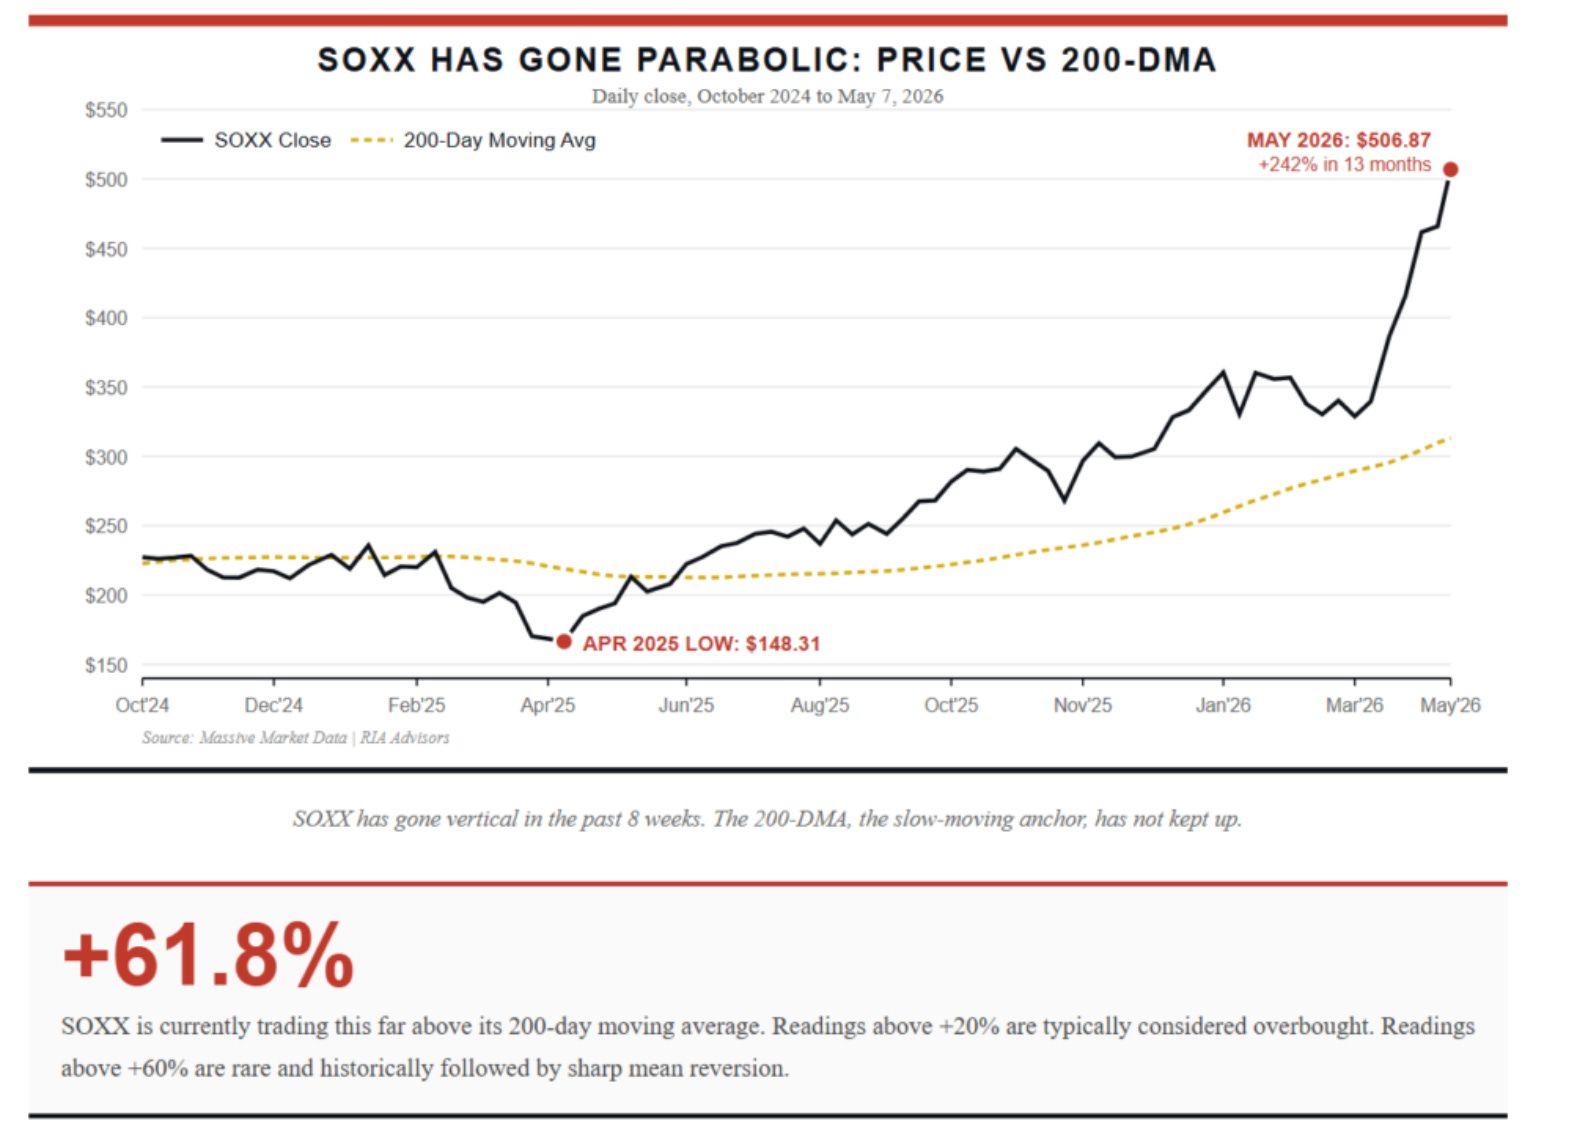
As has the highest beta exposure to the AI value chain.
Lance Roberts: semiconductor ETF SOXX is trading 62% above its 200-day moving average.
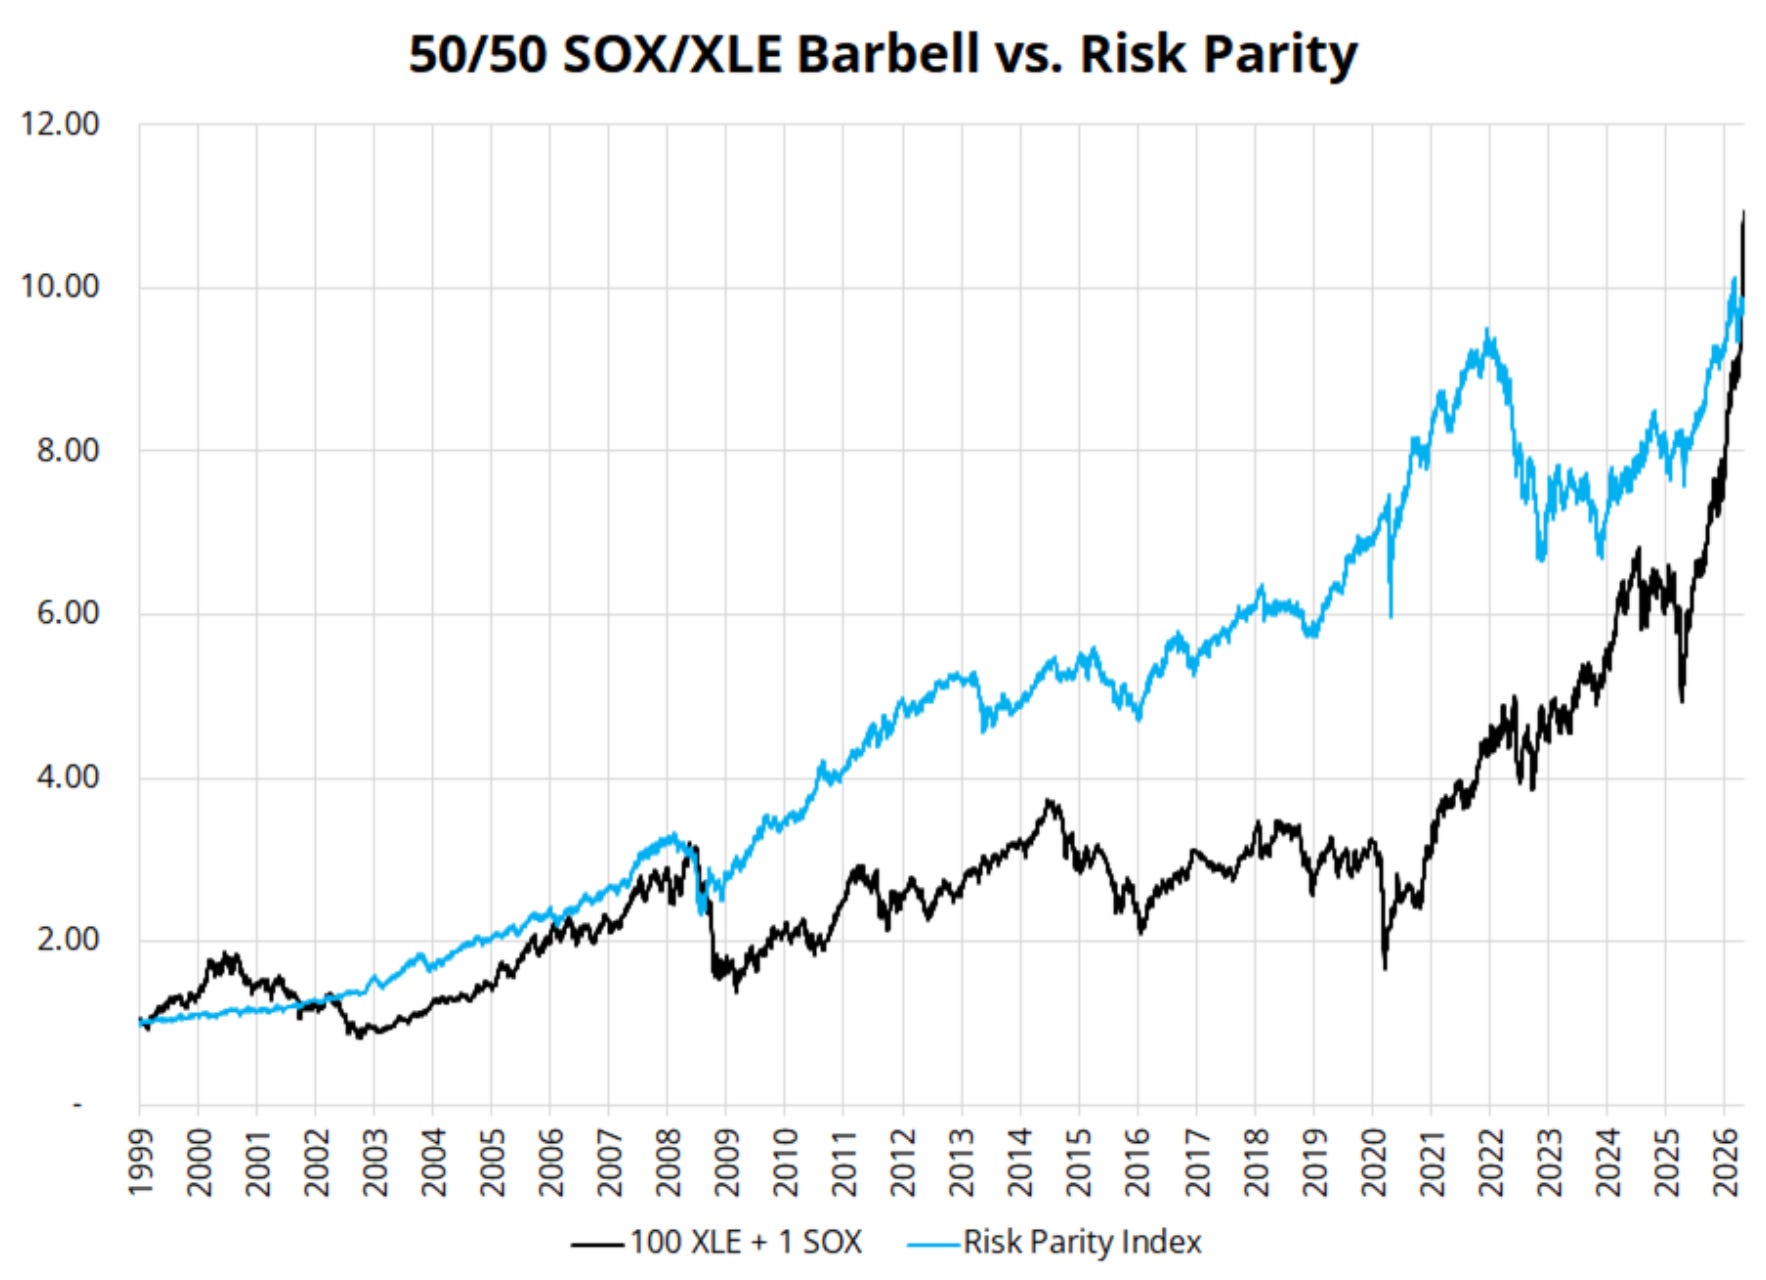
A good time to chart parabolas vs risk parity - thanks Brent Donnelly.
Long-term investors don’t get rich buying the thing that just went parabolic. They usually get caught high and dry doing that. They get rich by seeing things others don’t…I am not calling a top in semis or oil. I am just saying that momentum investing has its limits.
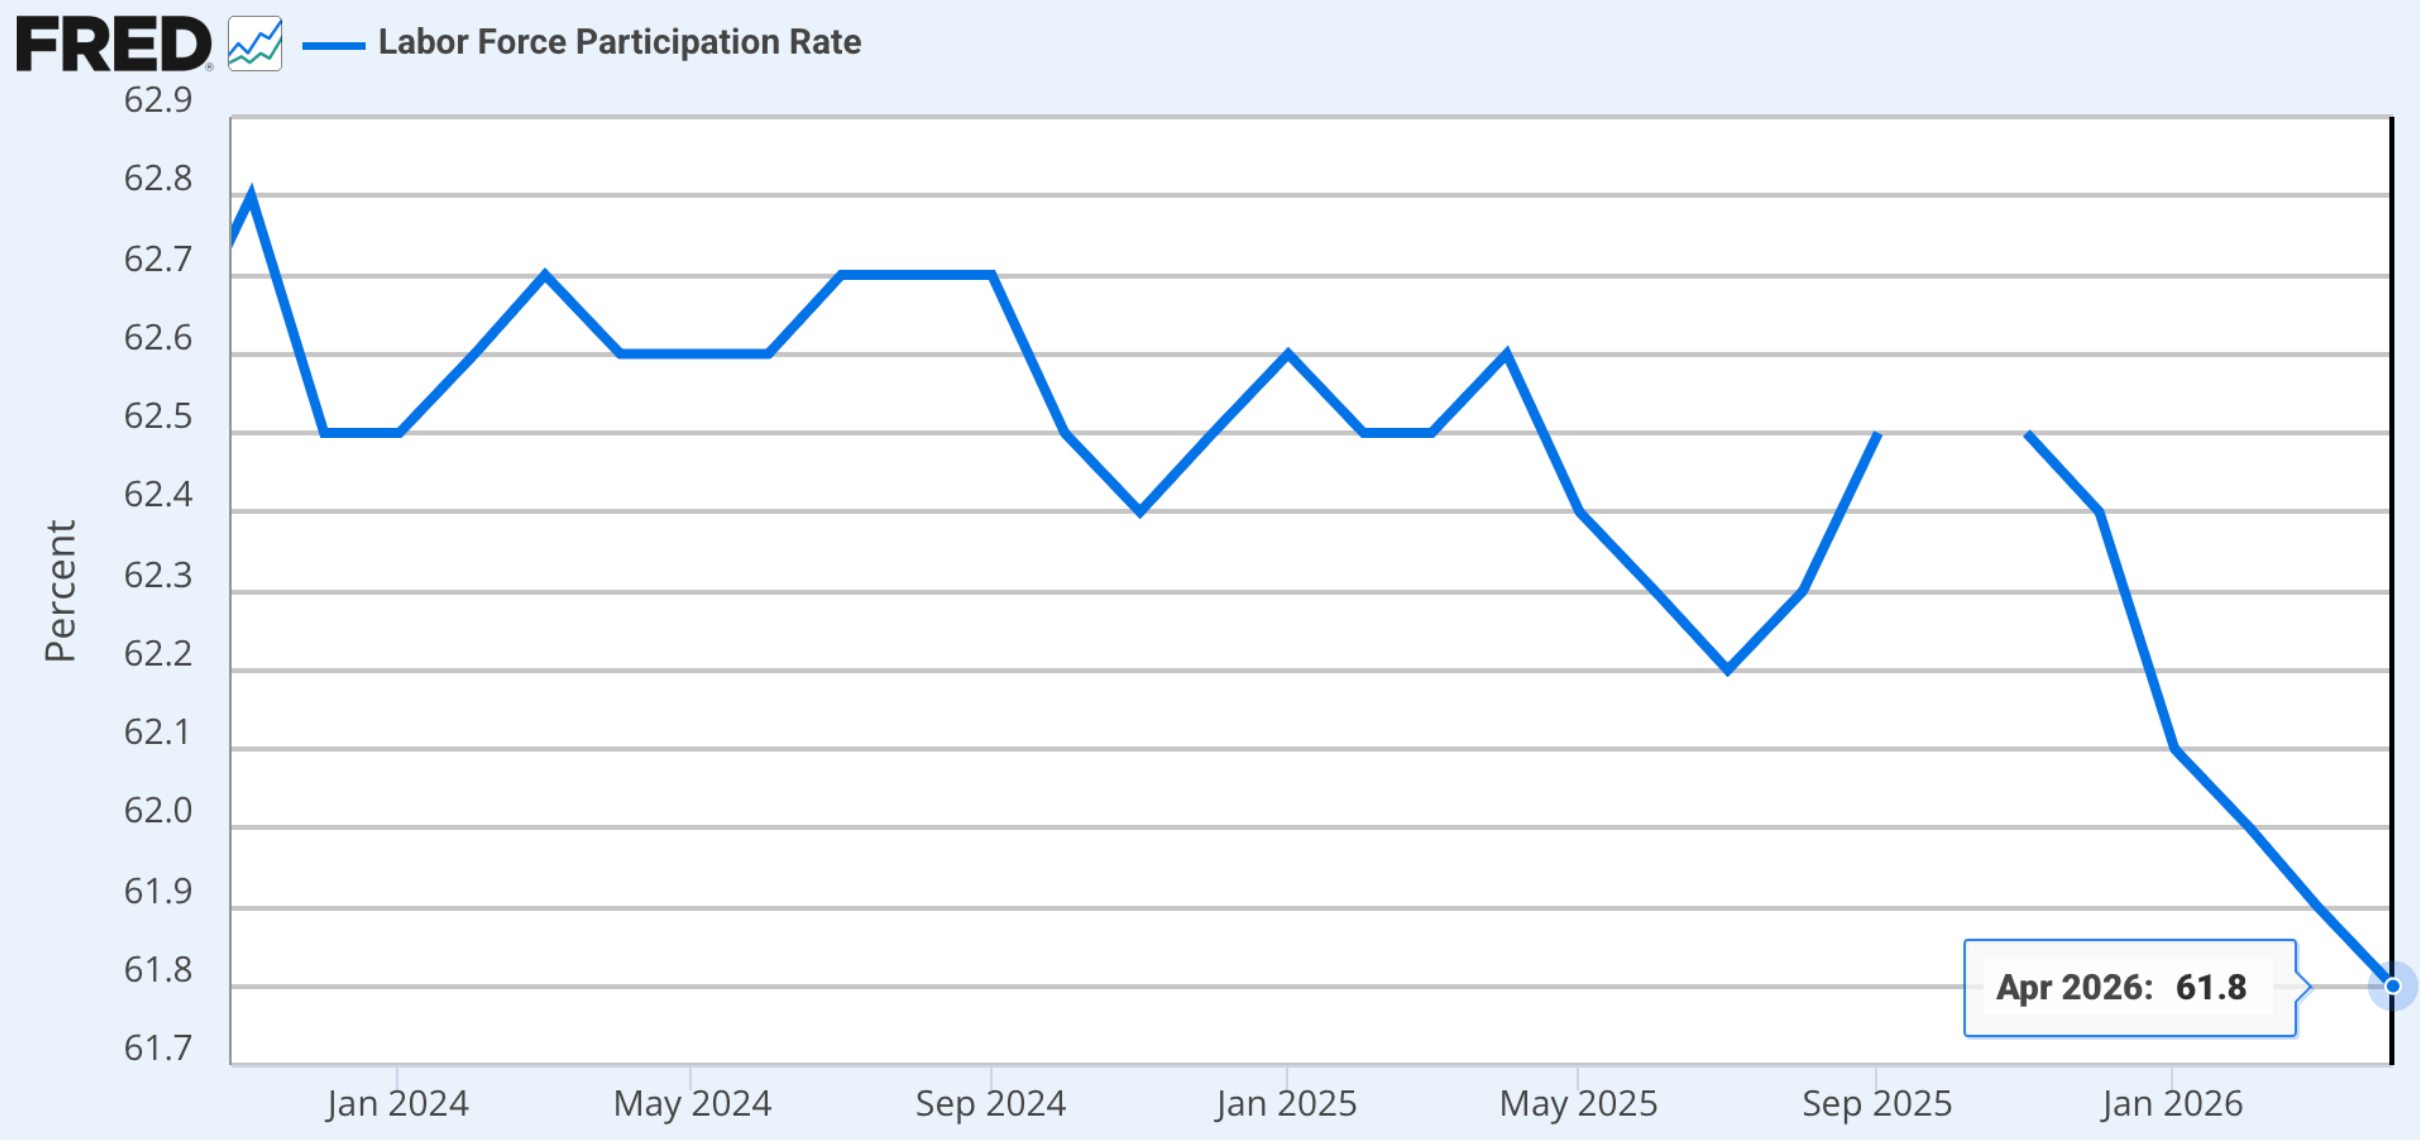
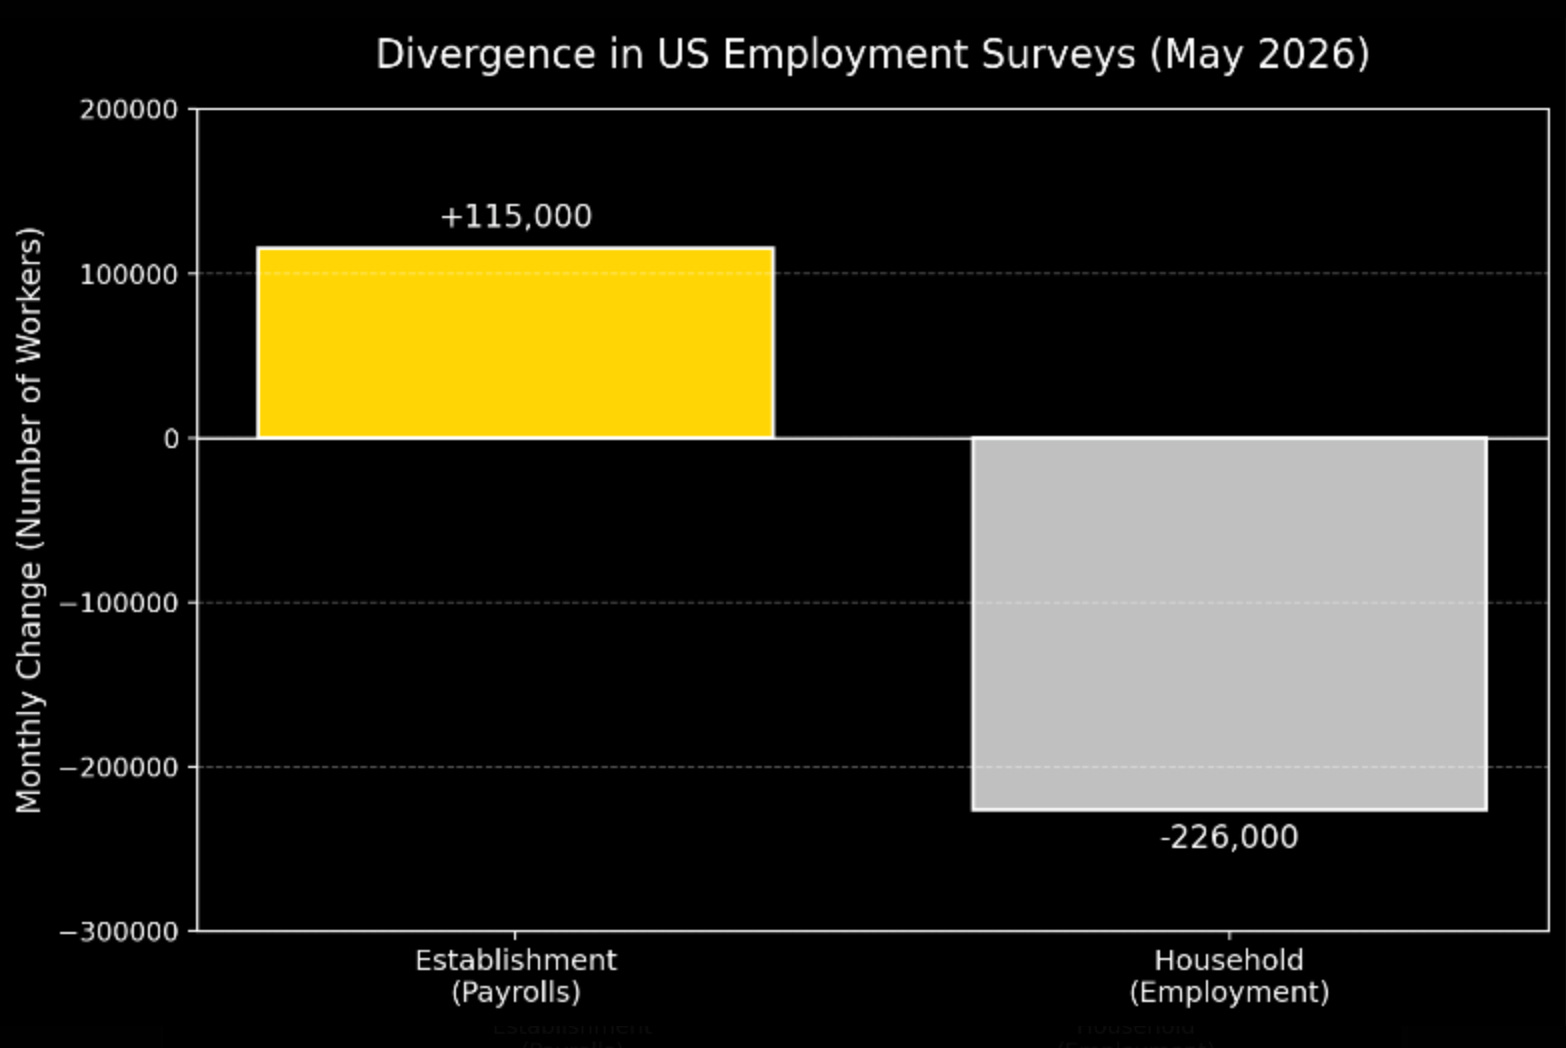
Two of the many jobs charts that quietly contradict the payrolls print.
The Coastal Journal : Labor-force participation fell to 61.8 (the lowest level under President Trump).
And the biggest divergence in the report was between the two employment surveys. The household survey captures the non-institutional population (self-employed, agricultural workers, and unpaid family workers).
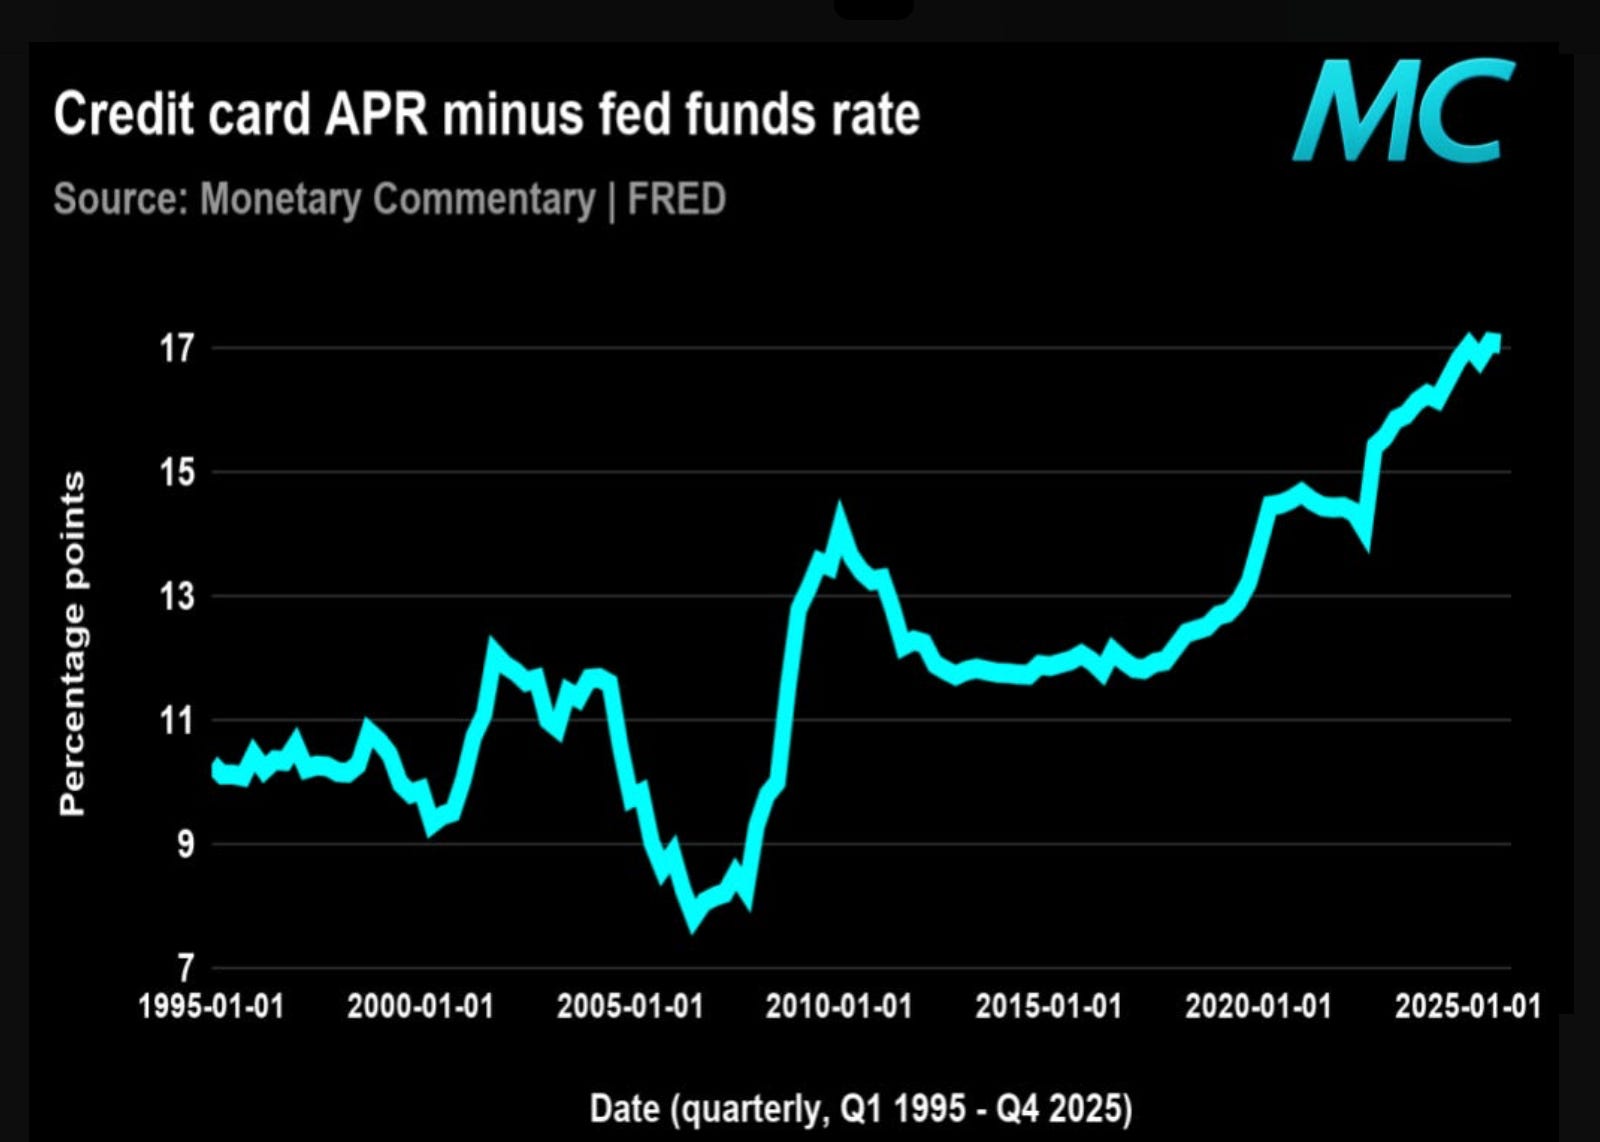
Credit card stress has moved beyond the Fed’s control.
Monetary Commentary: “One of the most important borrowing channels for lower-end households is still getting more expensive relative to cash.”
The market is pricing two different economies.
Alpha in Academia: Sharpe ratio dispersion is unusually wide.
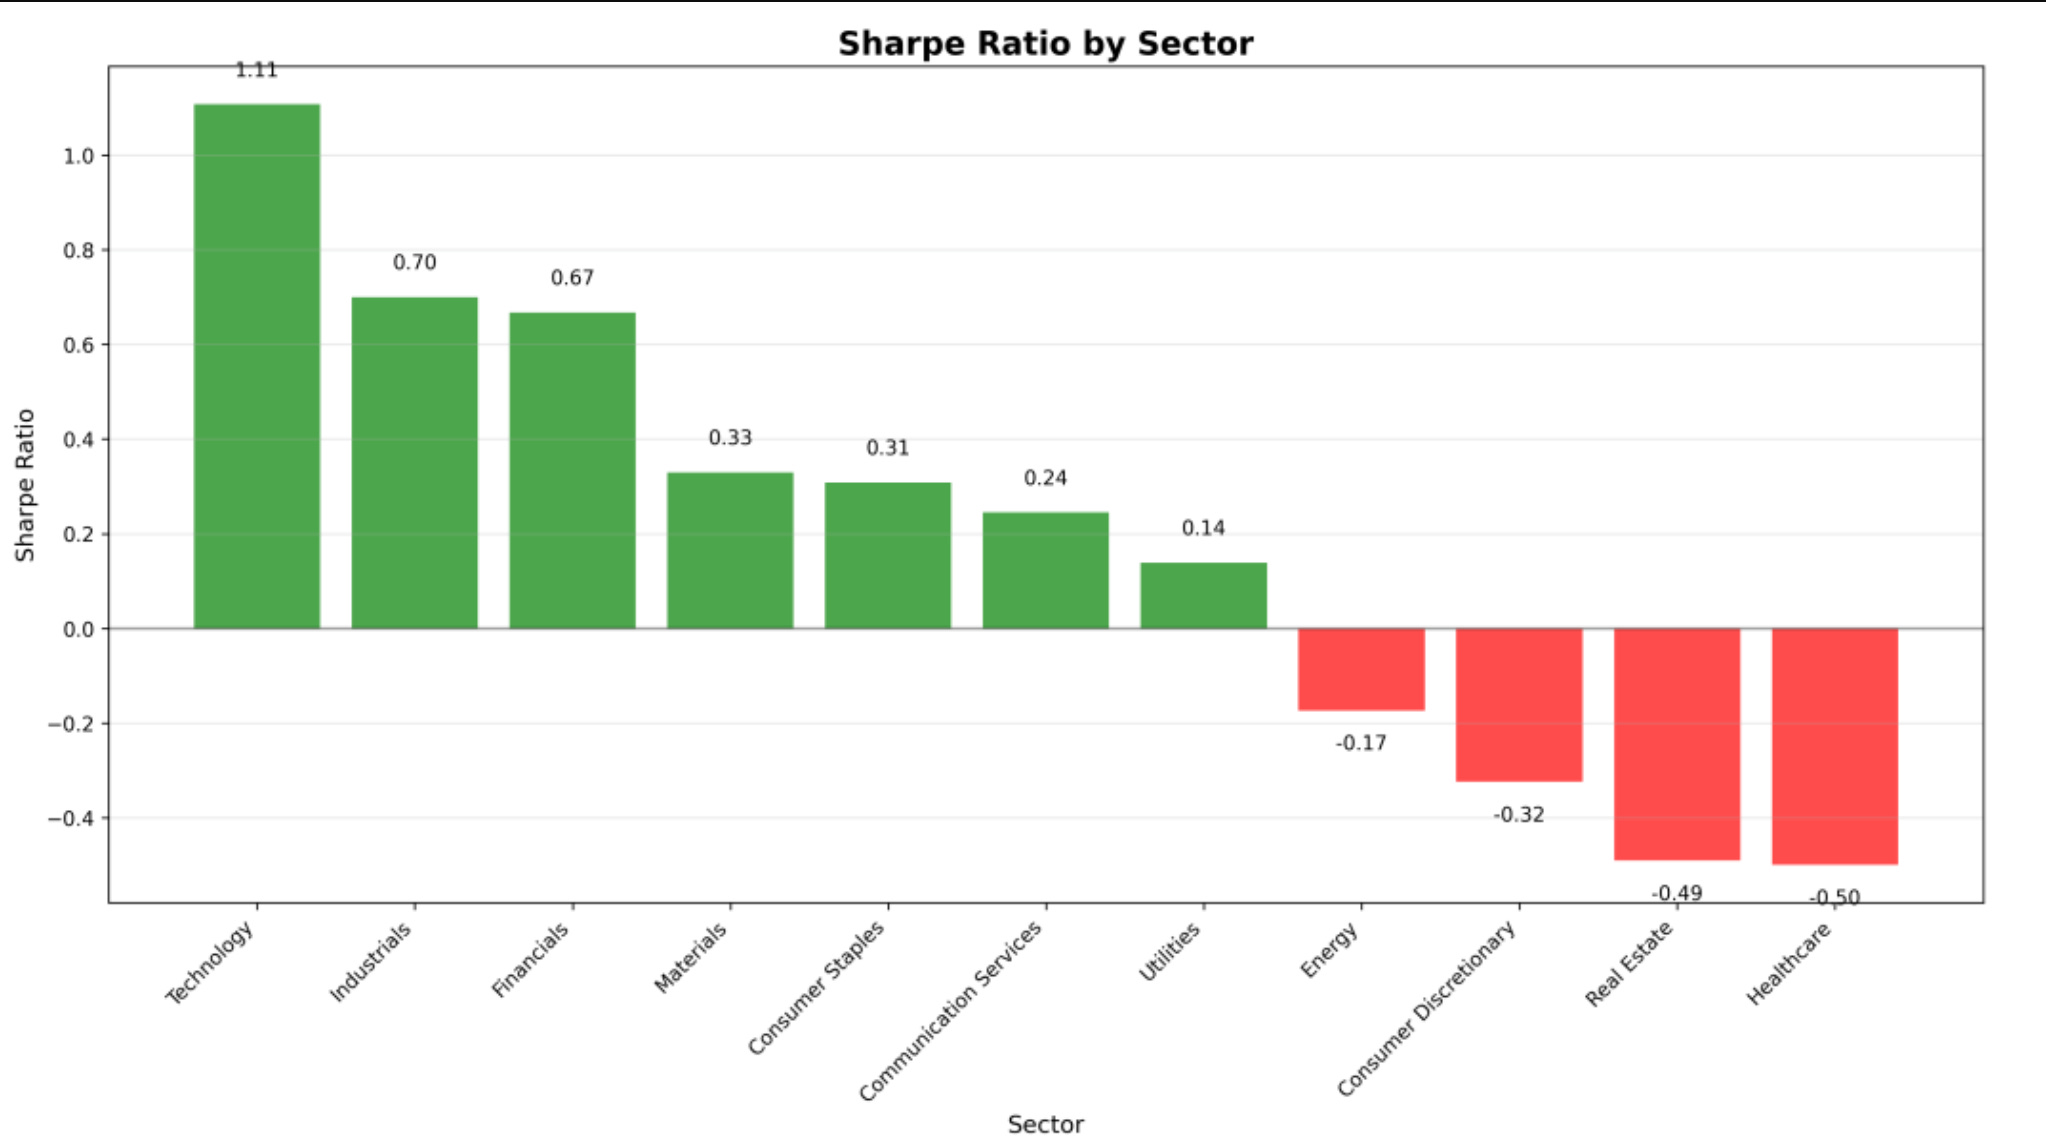
In normal markets, sector Sharpes cluster within maybe 0.5–0.8 of each other over a trailing window. This kind of spread is what a regime-change tape looks like. The market is pricing an economy where AI capex is a self-reinforcing flywheel, and one where the cost of capital is genuinely punishing.
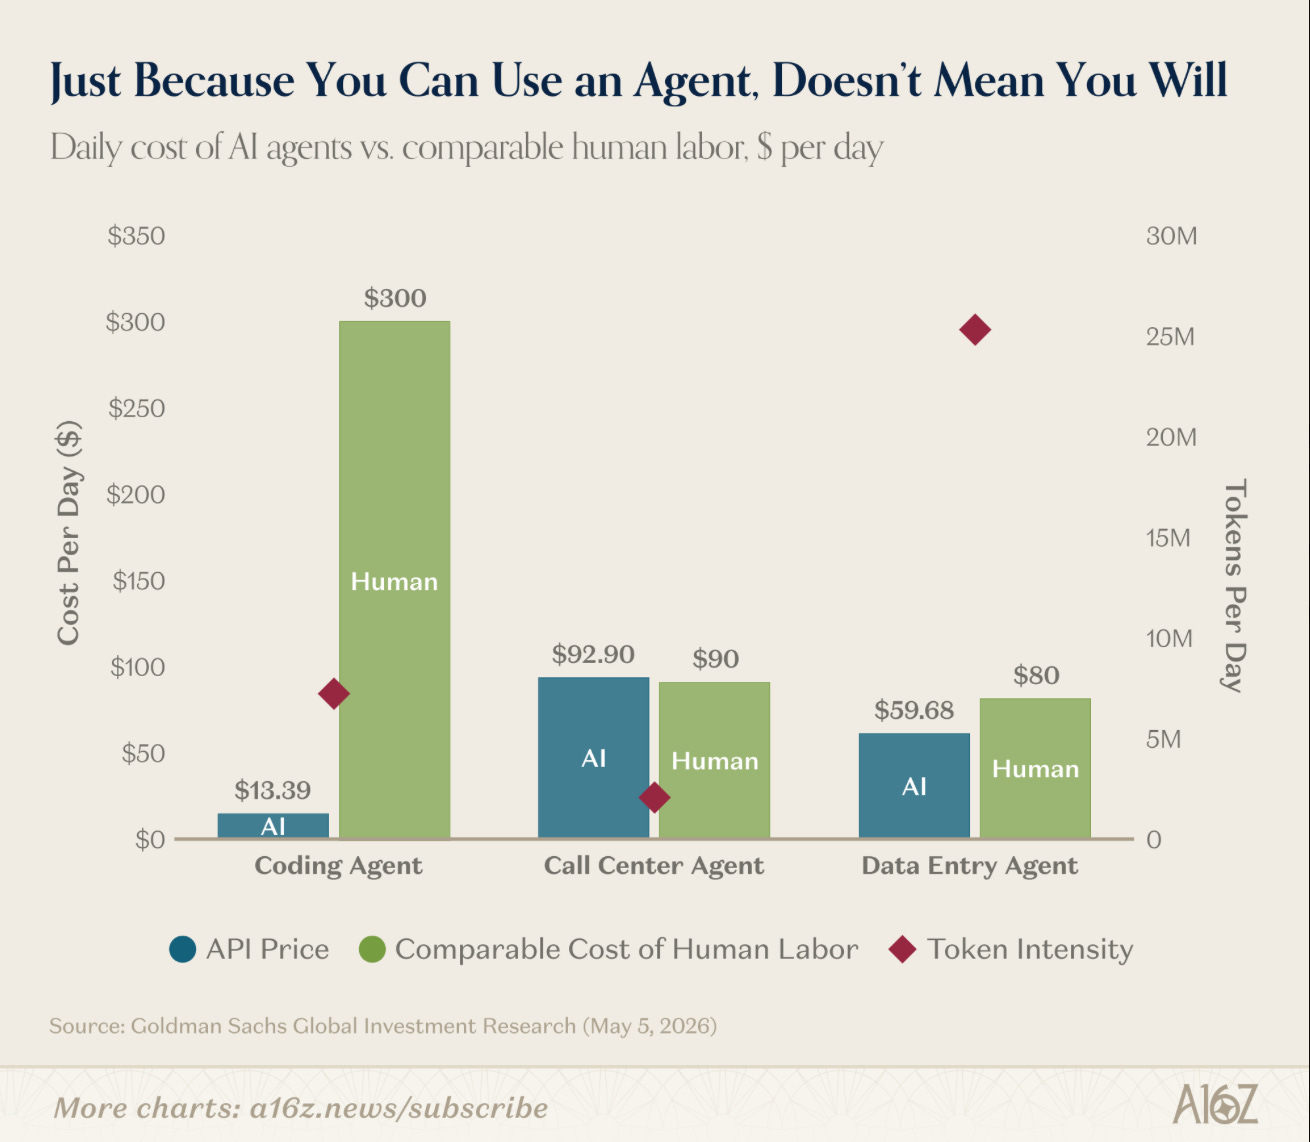
Goldman Sachs ran their own internal experiment and estimated the head-to-head costs of humans v. AI call center reps, as being roughly comparable - a16z.
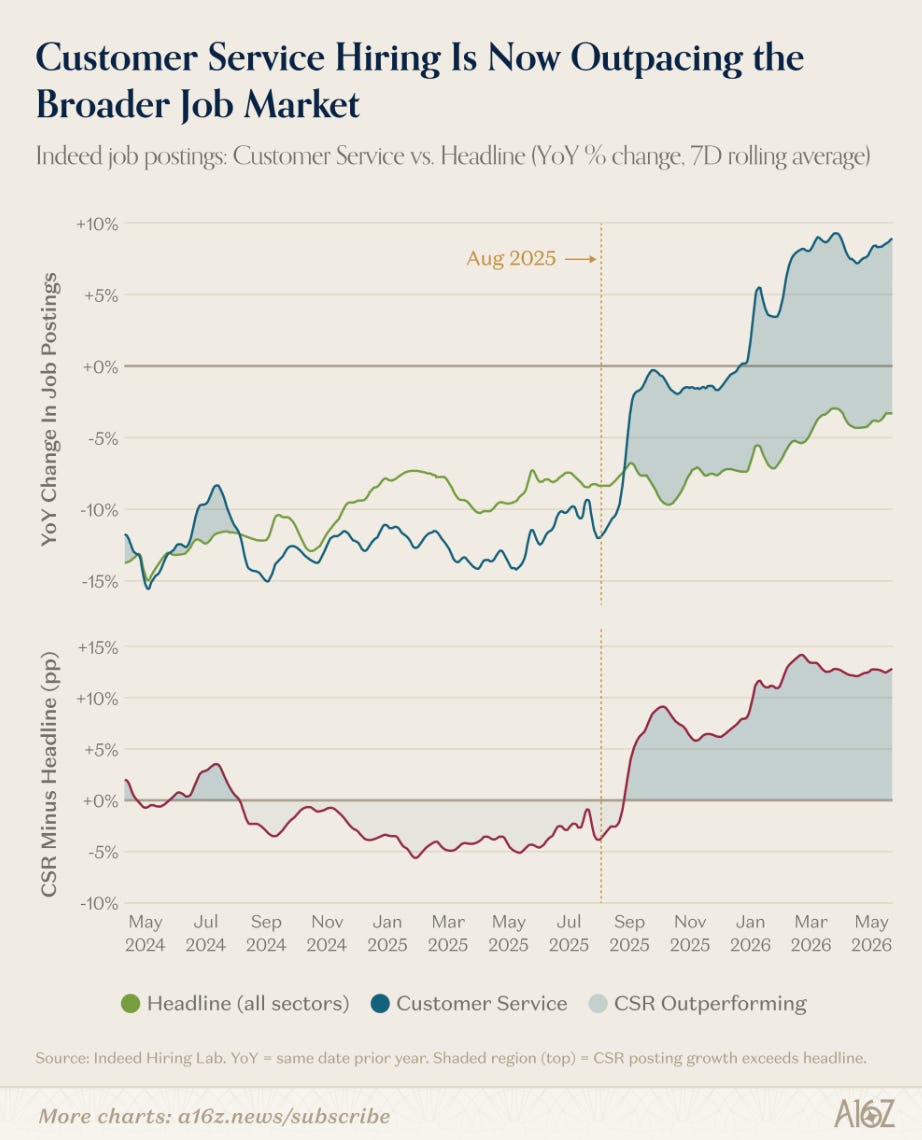
Which explains why…demand for customer service reps has perked up, more so than the field - a16z.
The 22pt gap keeping the soft-landing narrative alive - MarketStack.
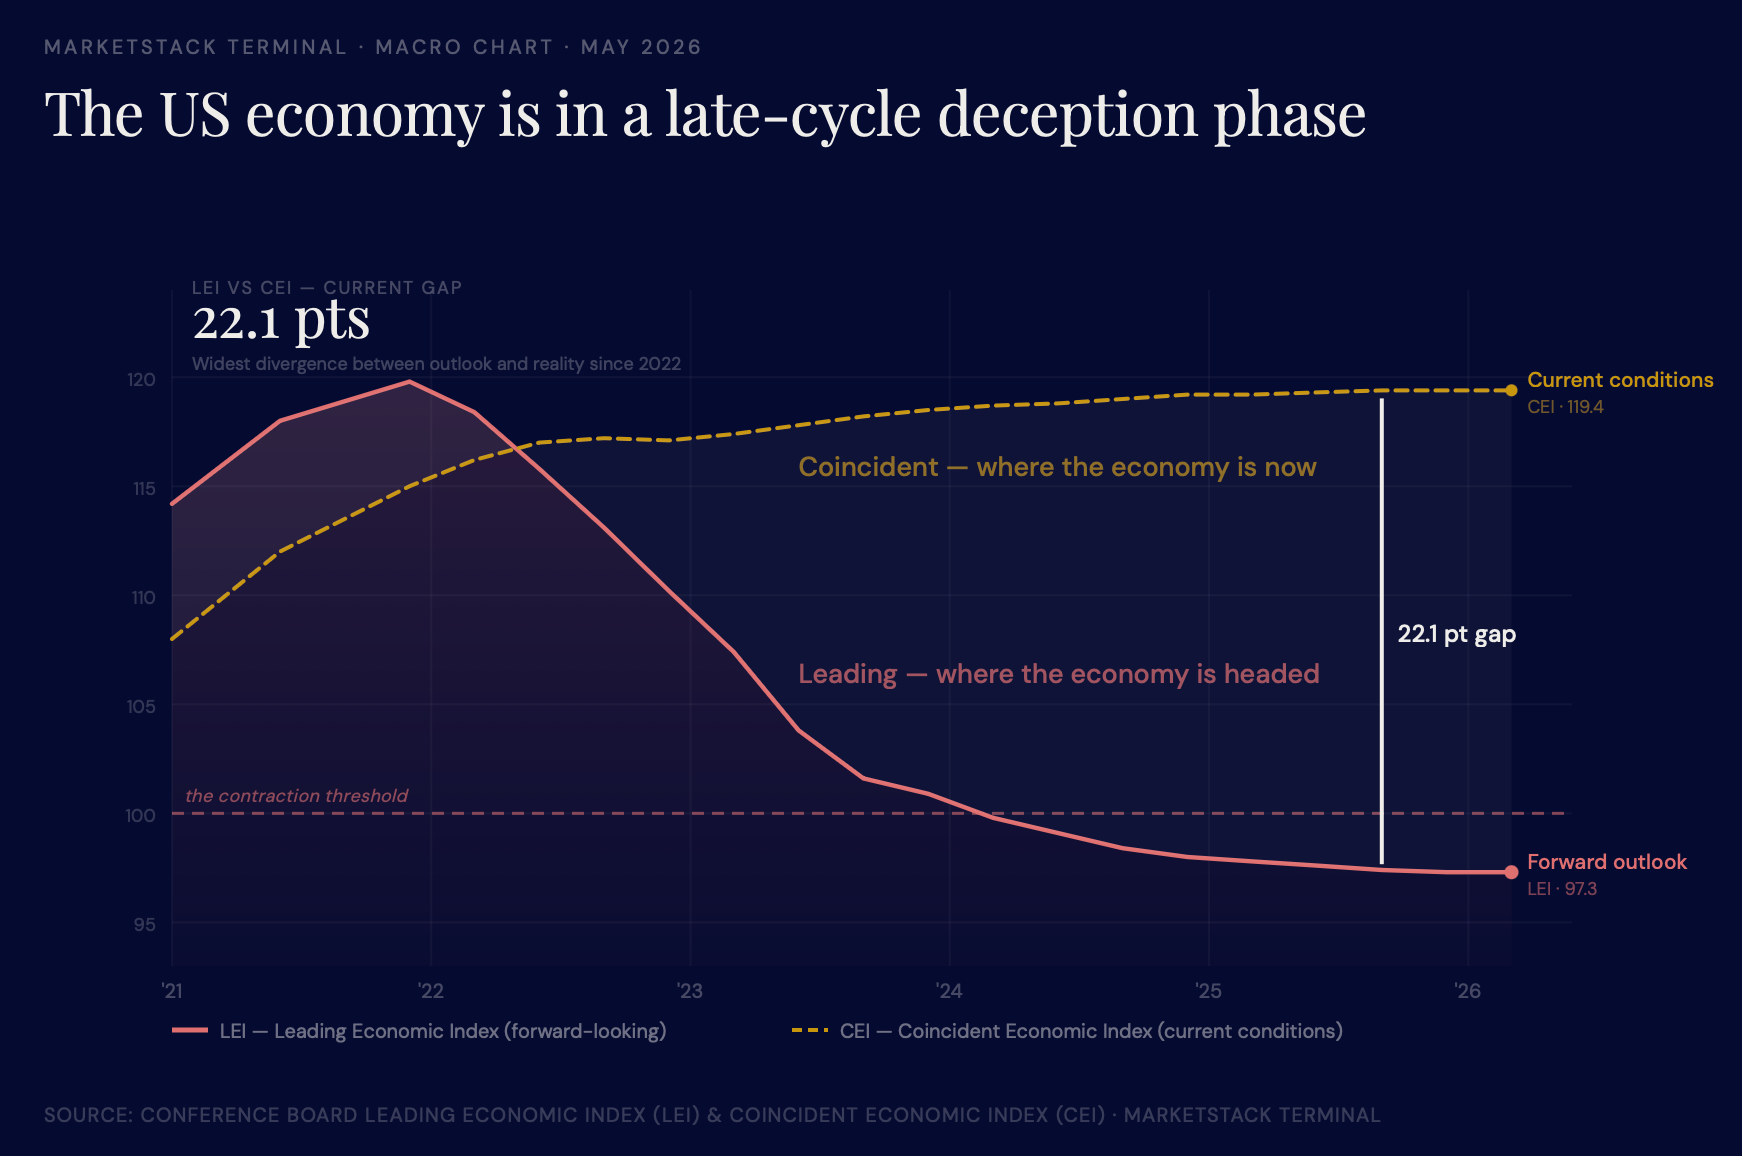
The gap is essentially measuring the tension between two things: the resilience of the labour market and consumer spending (CEI), versus the structural headwinds building in credit, housing, manufacturing, and expectations (LEI). Historically, the CEI eventually catches down to the LEI — not the other way around.
The next US LEI release is scheduled for 22 May 2026. Gregory Mannarino has a good chart on the LEI’s more recent dip (0.6% in March) for anyone who wants to Zoom in.
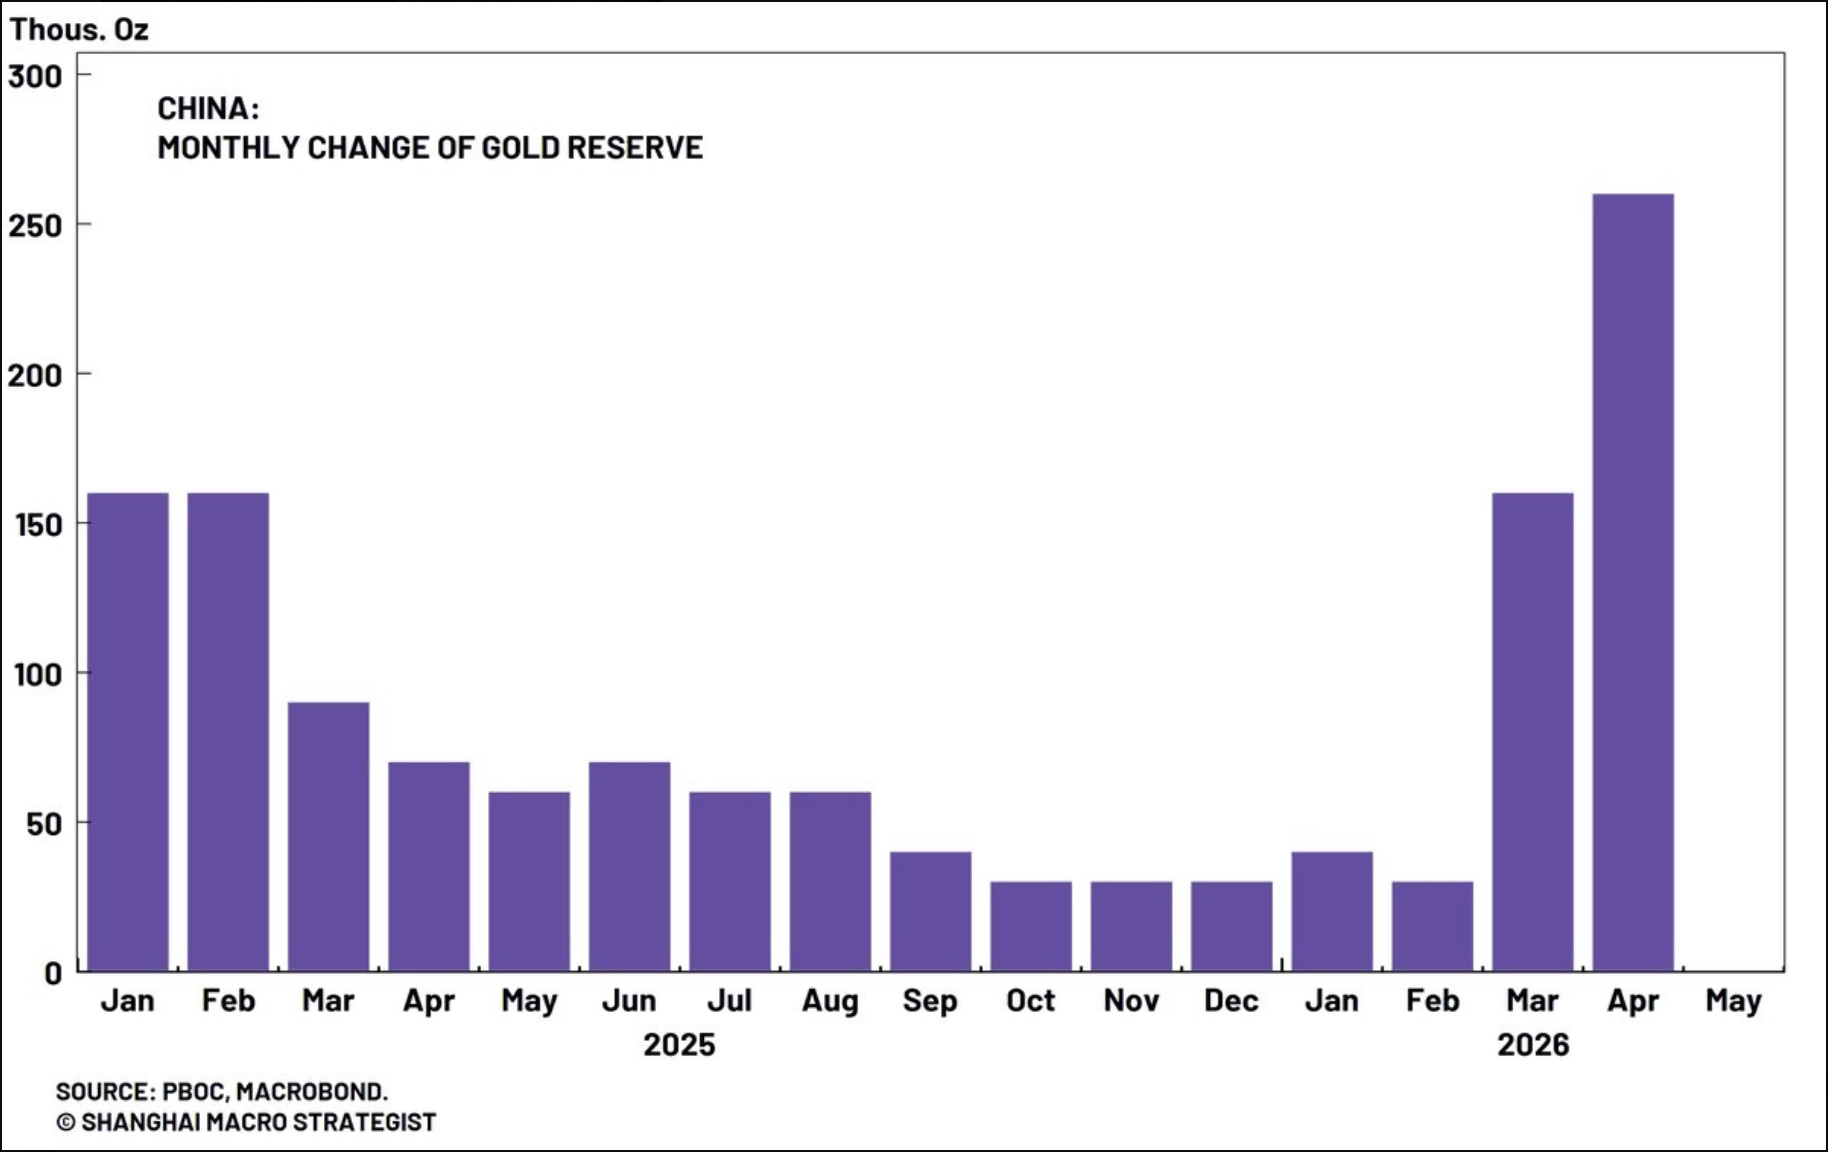
China is back to buying gold “BIG TIME“: The Market Dispatch.
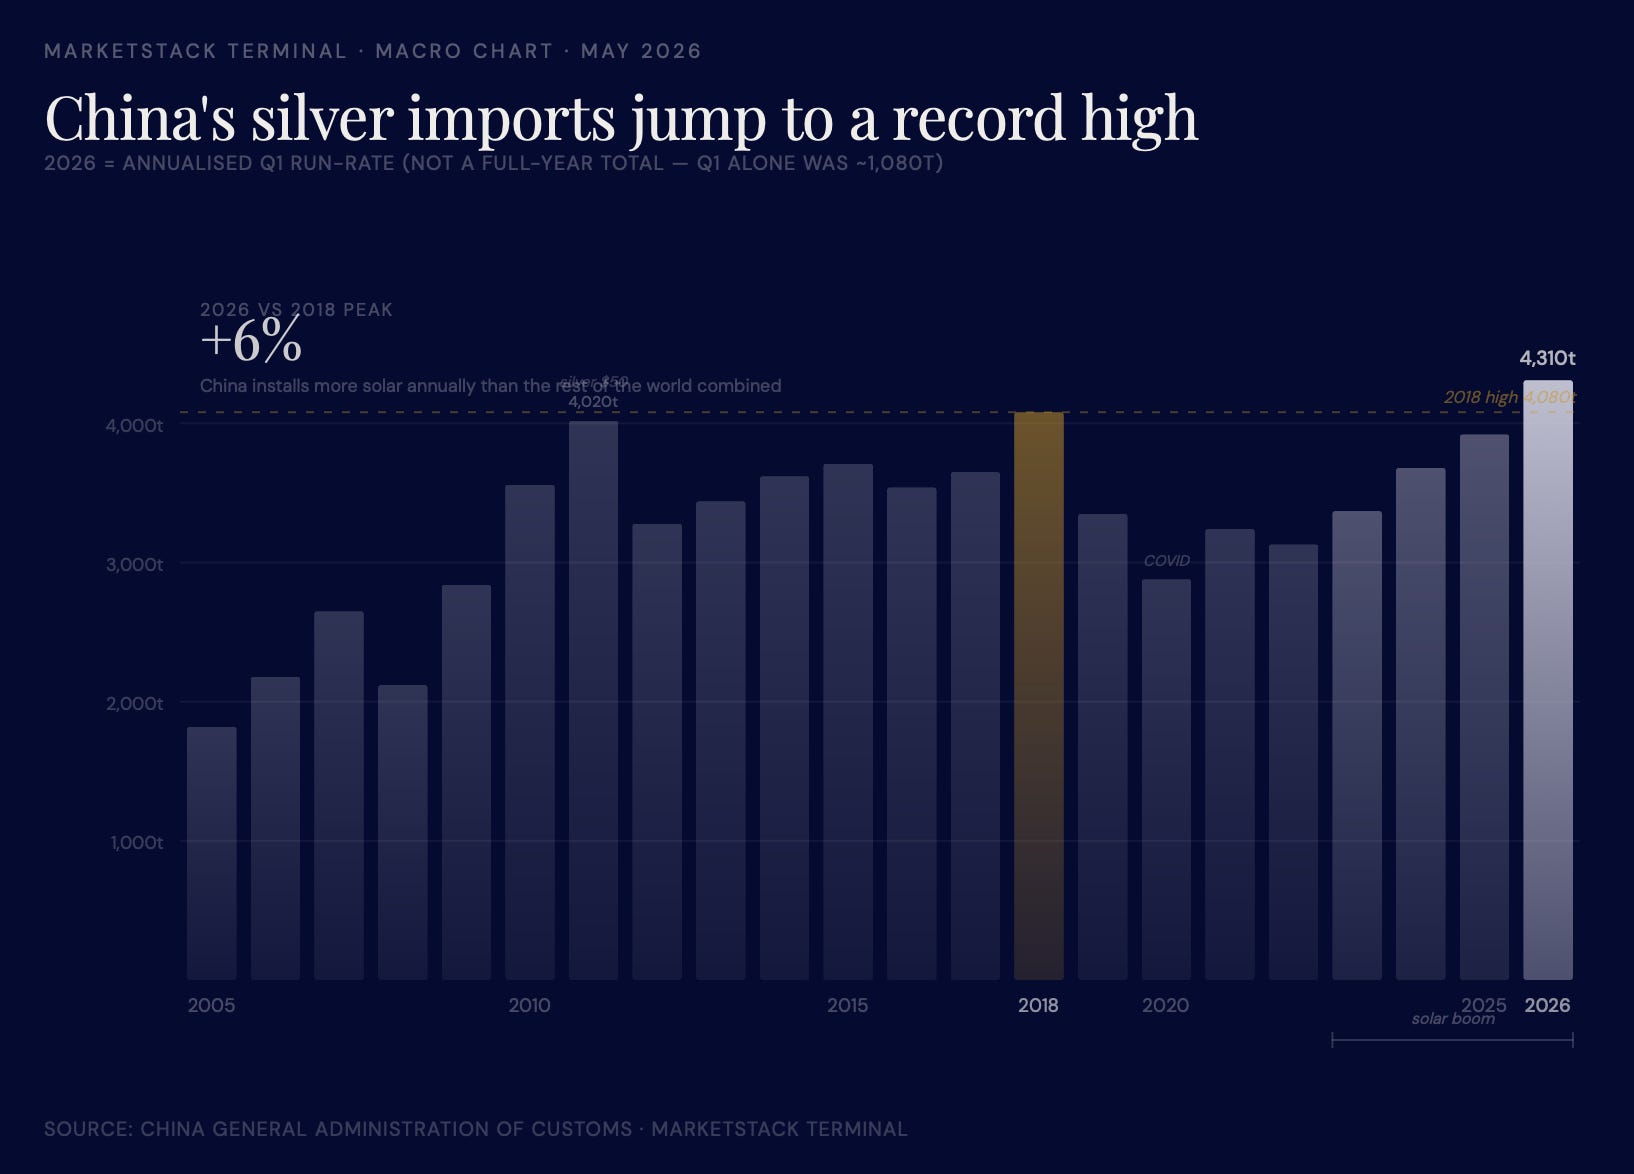
And importing record volumes of silver.
Driven by solar panel manufacturing and retail investors, the March data print took the implied annualised figure +6% over its 8 year peak.
Lastly - big changes to the MarketStack Index: v2 weights 80% on Bestsellers durability and 20% on Rising emergence. Writers buried by the old Rising-only methodology now surface much higher to reflect their readership strength:
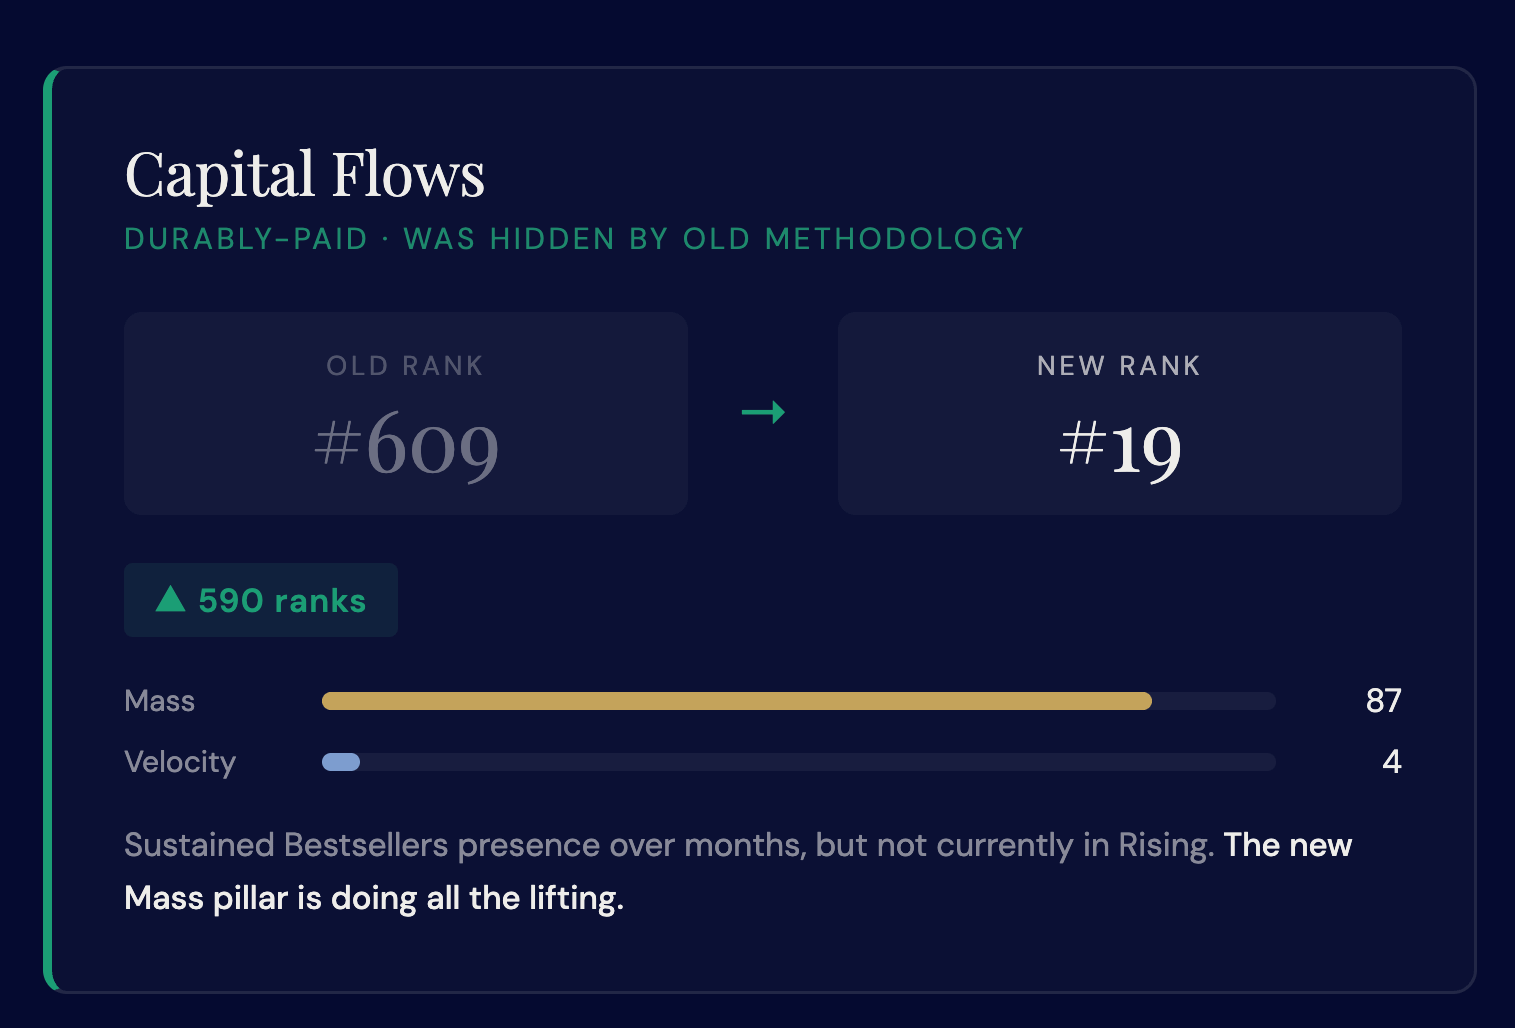
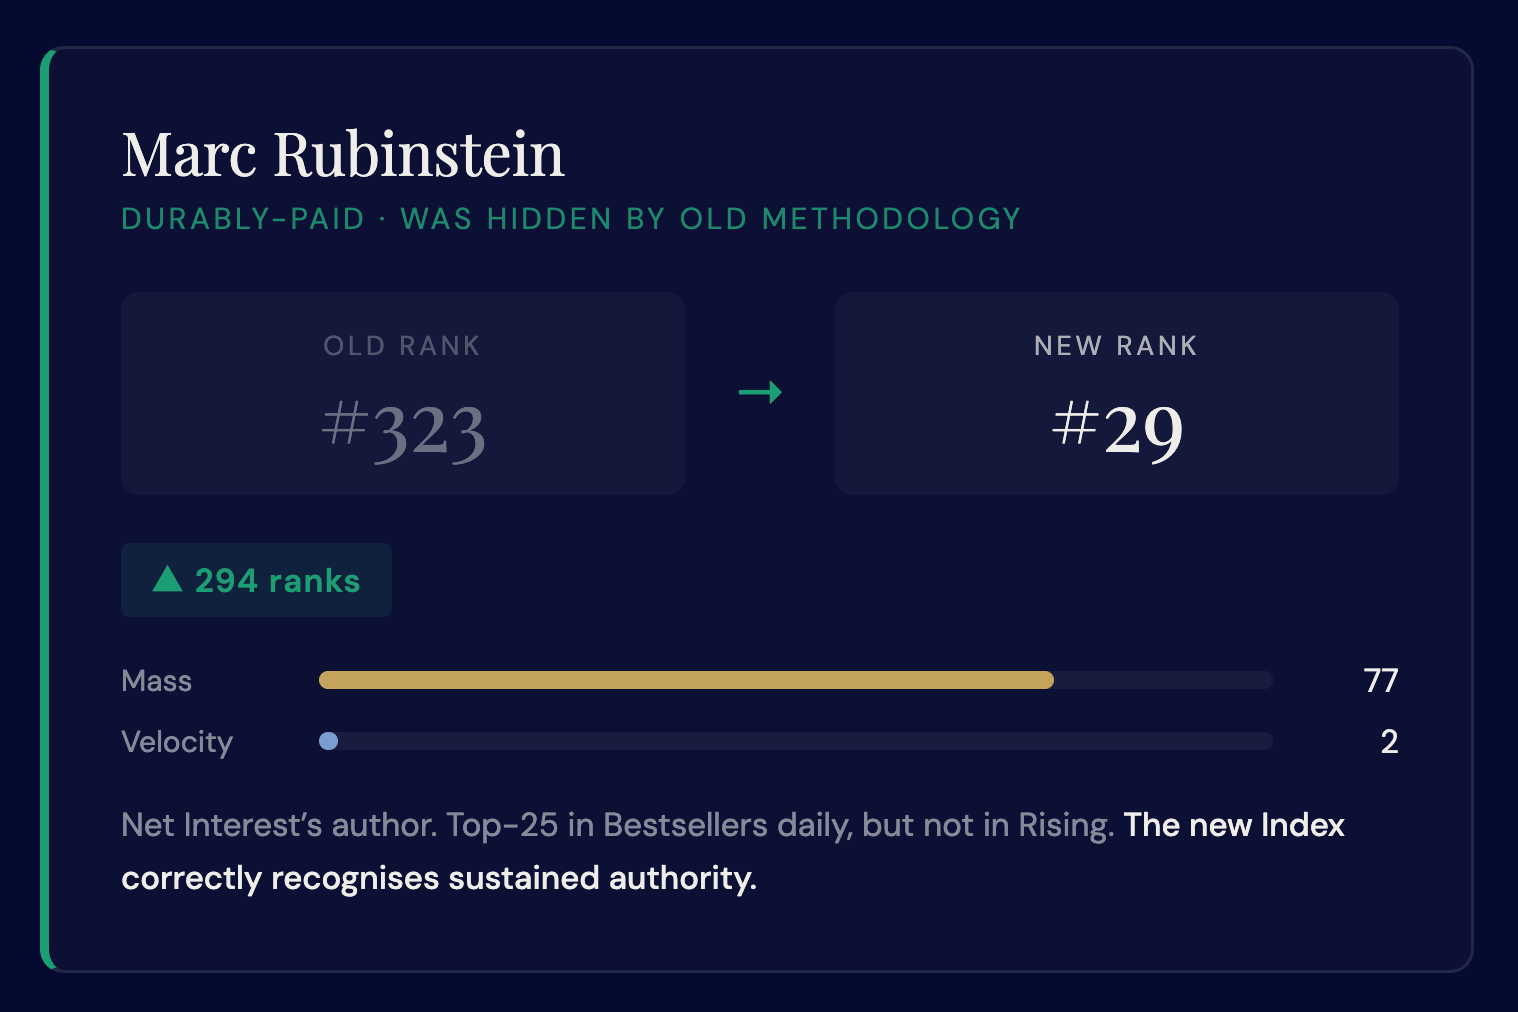
And writers inflated by Rising momentum without sustained sales drop sharply.
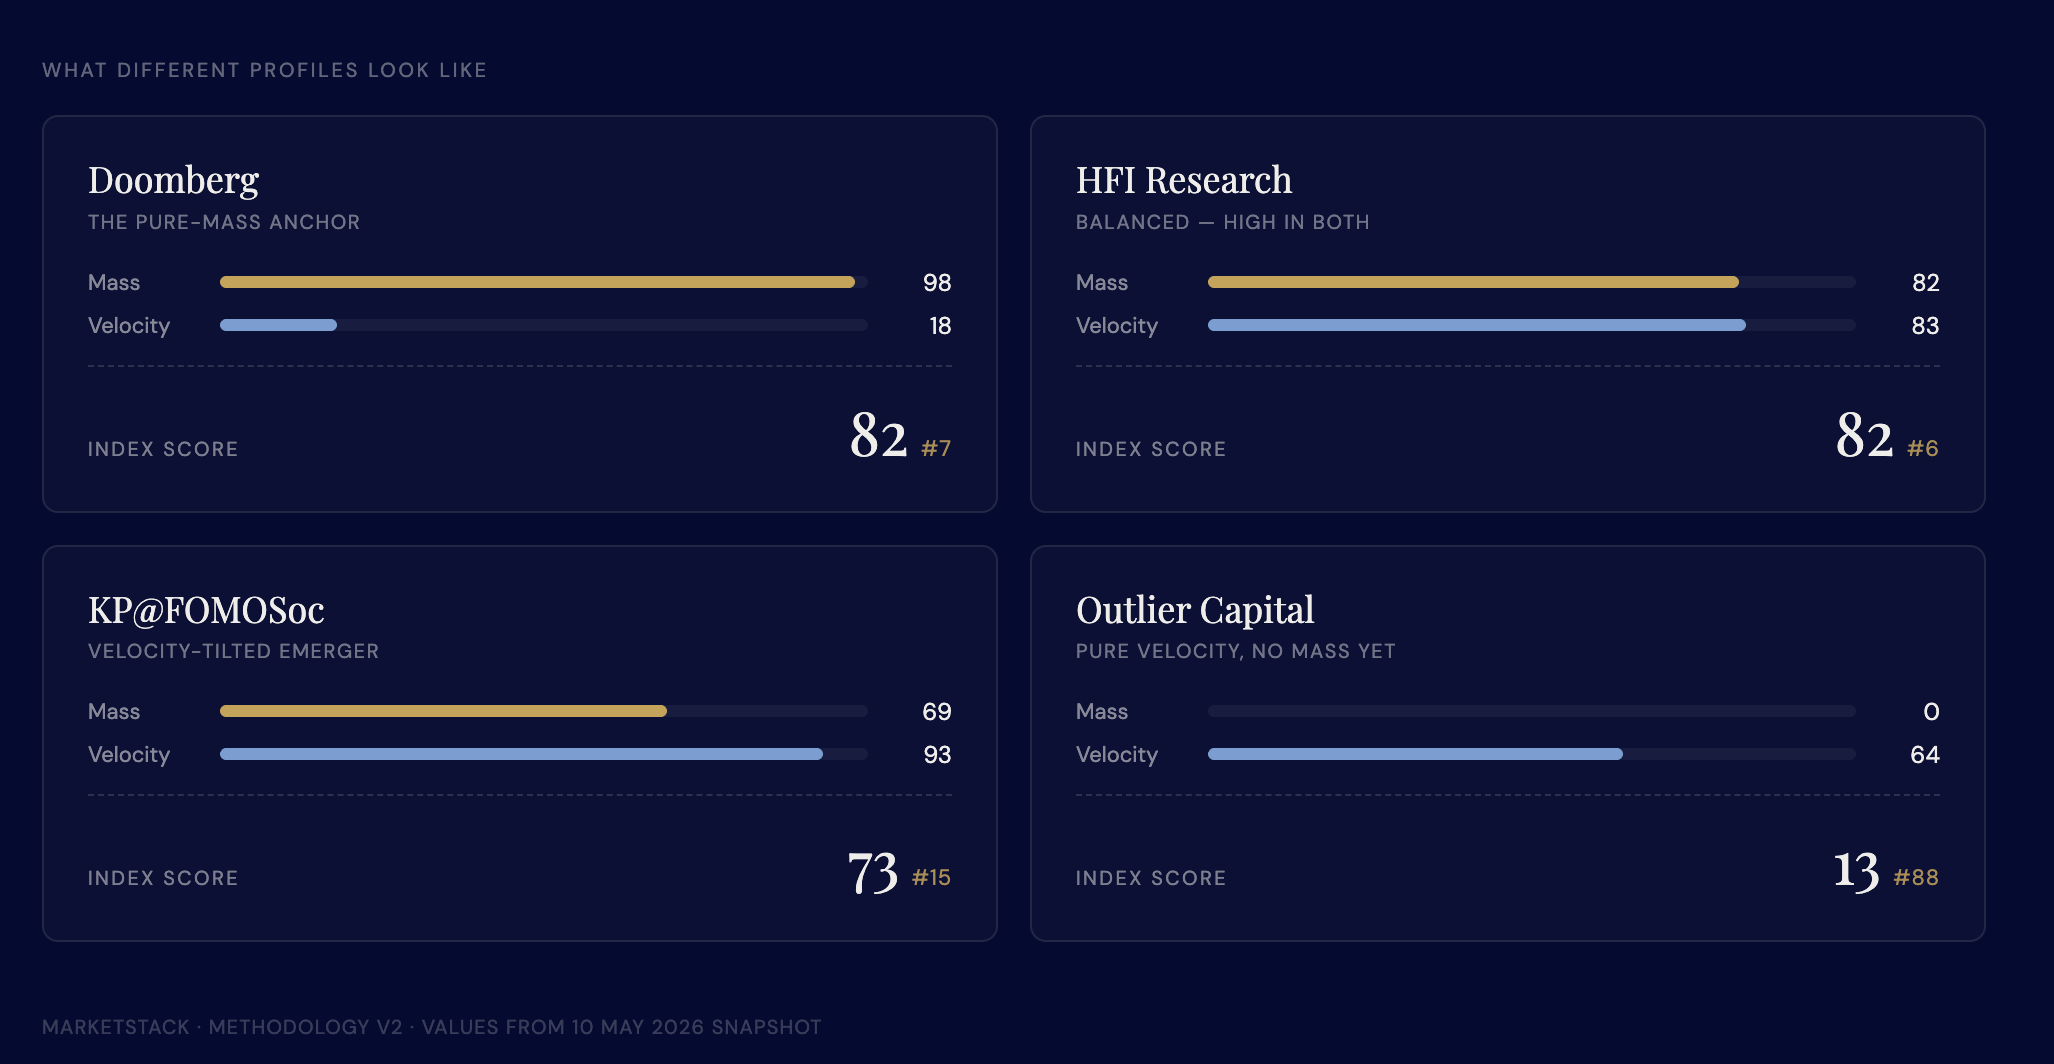
But is also means that - based on recent breakthrough strength - authors like HFI Research can rank next to authors like Doomberg, who sit 14 points ahead of them in Bestsellers. And emergent authors like Outlier Capital don’t get lost.
Visit MarketStack The Edit · MarketStack Terminal
MarketStack is free today. But if you value my work, you can pledge for a future subscription. MarketStack is an independent, anonymous publication summarising publicly available commentary and views from across financial media. Nothing here constitutes financial advice or a recommendation to buy, sell or hold any security. All views are a synthesis of public information. Past performance is not a guide to future results. This publication is not authorised or regulated by the Financial Conduct Authority. The author writes anonymously in a personal capacity.
Great article man, actually interesting
Subscribed, would love to have you along too🙂🙌