

TickerStack
All the writers covering the tickers you follow, in one place.

Not investment advice.
The Terminal now has a live coverage map of every ticker mentioned in articles published by authors in MarketStack’s feed - which includes 90%+ of authors in the MarketStack Index and 90%+ of Bestsellers.
The TickerStack tab currently covers 443 tickers across 1314 post mentions from 180 authors. It deliberately does not extract sentiment or directional conviction. TickerStack maps coverage, not opinion.
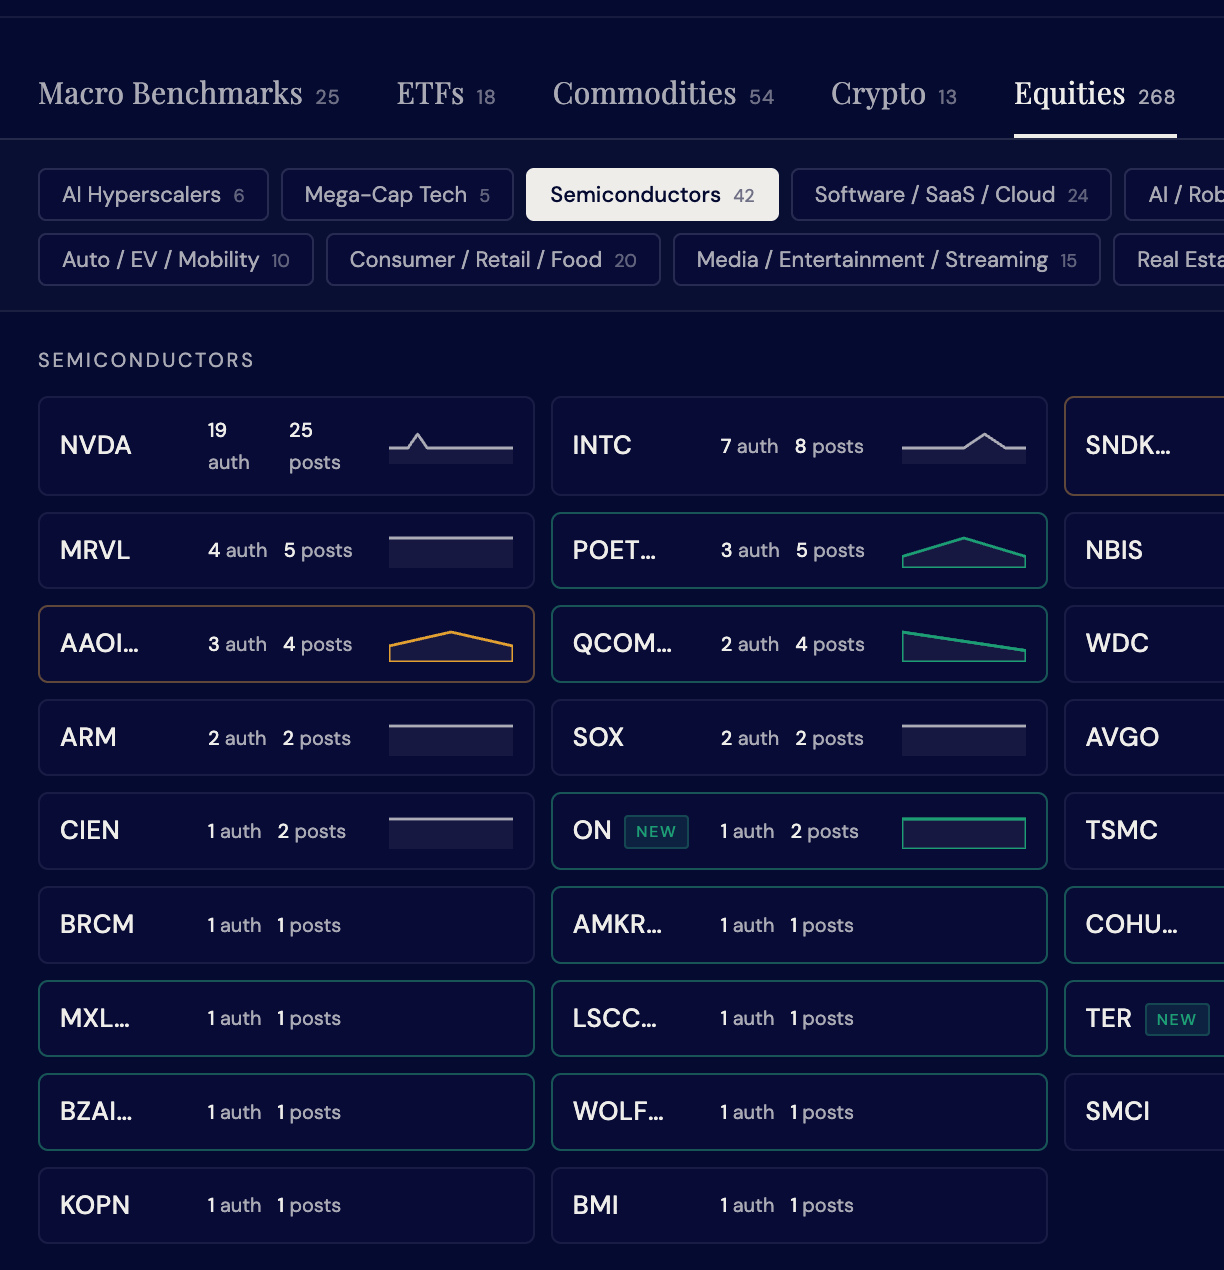
The universe is genuinely cross-asset, in line with the evolution of coverage on Finance Substack:
Macro Benchmarks — equity indices (cash & futures), FX pairs, volatility, rates ETFs
ETFs — broad-market and sector
Commodities — energy futures, oil & gas equities, LNG, precious metals (futures, ETFs, miners)
Crypto — coins, stablecoins, miners, treasuries
Equities — broken down into sectors
Everything Else — international ADRs and one-off names that don’t fit cleanly elsewhere
Why this matters
The Substack universe is now deep enough that on most named tickers there are multiple genuine specialists writing thoughtfully. The hard problem is finding them. TickerStack inverts the usual flow: instead of starting from an author and finding what they write about, you start from a ticker and find who writes about it.
A few patterns the data already surfaces:
Macro/trading writers anchor the top — SPX, CL, BTC, GLD, ES, NQ, DXY all sit above the 12-author threshold
Semis is the densest equity cluster — 42 distinct tickers in coverage, NVDA still the centre of gravity
Biotech is a long tail of specialist names — 50+ small-caps, almost all single-author, which is exactly the pattern you’d expect in a domain dominated by individual research
Crypto is real but concentrated — BTC dominates, ETH and XRP exist, the rest is one-author niches
Tankers/shipping is a tight specialist community — one author covering nine tickers cleanly
AI Hyperscalers as their own bucket earns its place — MSFT (13 authors), AMZN (11), AAPL (10), ORCL (9), GOOGL (9), META (8) all densely covered
Dynamic coverage of dynamic coverage
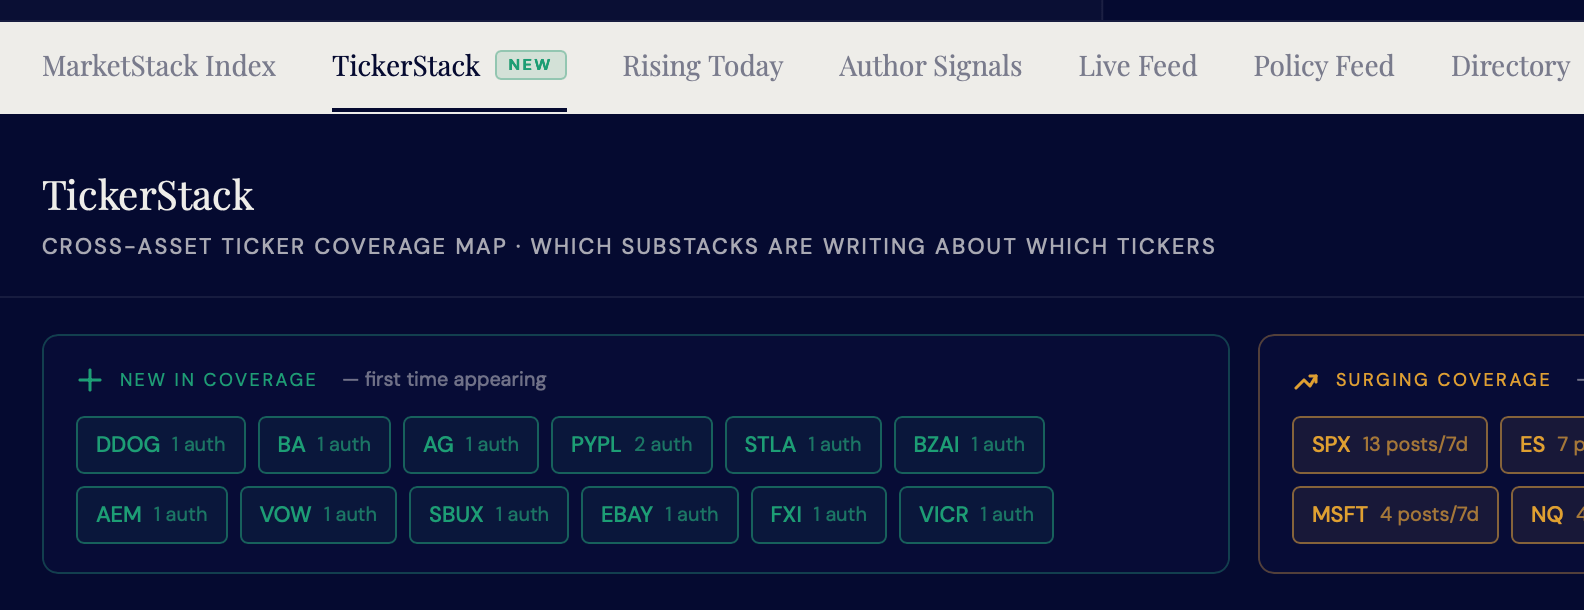
At the top of TickerStack is a strip which shows you:
New in coverage — tickers appearing in the corpus for the first time within the last 14 days. Green-bordered chips. This answers “what’s just come into focus?”
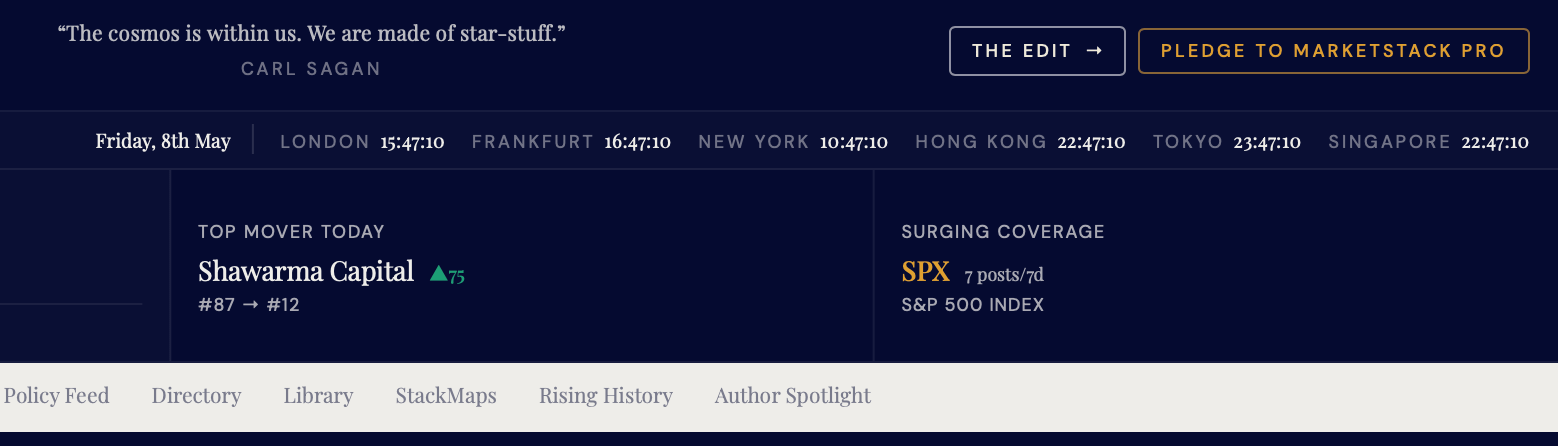
Surging coverage — tickers with the biggest 7-day jump in post frequency. Gold-bordered chips. SPX, CL, AAPL, MSFT and ES tend to live here permanently; smaller names rotate in and out as themes catch fire.
Ticker(s) with surging coverage also appear as a live signal on the Terminal’s main stats bar:
The grid — full coverage map
The main body groups every tracked ticker by asset class. Each ticker row shows author count, post count, and a 14-day mention sparkline so you can see velocity at a glance.
The colour language is consistent throughout: green = newly emerging, gold = surging right now, plain = background coverage. A quick scan down any section tells you instantly where the heat is.
Search filters in real time, smart-handling short queries (typing “ES” matches the ES ticker, not every ticker in the Equities section). Sort by author count, post count, recency, or alphabetical.
The detail drawer — who covers what
Click any ticker and a side panel slides in showing:
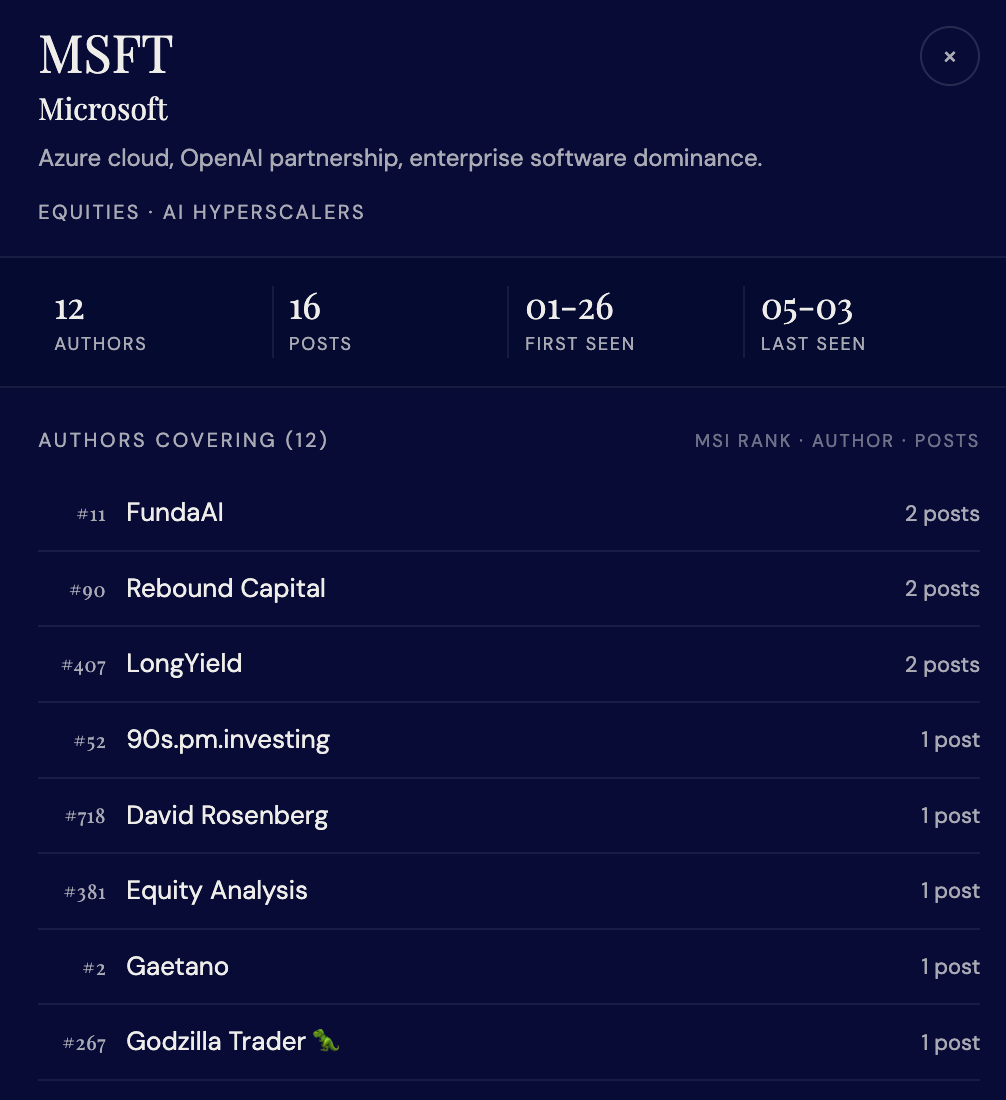
The ticker, the company / instrument name, and a one-line description
Asset class, total authors, total posts, first-seen and last-seen dates
The full author roster, sorted by mention count, each labelled with their current MSI rank for credibility context
Up to 30 recent posts, linked through to the original Substack
Author names click through to the full Author Page in the Terminal — making the loop from ticker → author → full profile genuinely useful
The history file accumulates day-by-day, which is what powers the sparklines and the “first seen” detection. Right now most sparklines reflect the bootstrap snapshot — give it two weeks of daily runs and the velocity signals will sharpen considerably.
Where to find it
TickerStack sits second in the tab bar, right after MarketStack Index, marked with a green NEW badge. Open the terminal, click TickerStack, and the data loads instantly.
This is v1. Asset-class buckets, the 14-day window for “new”, and the post-velocity metric for “surging” are all calibrated to the corpus I have today — they’ll evolve as the dataset grows. If a ticker you care about is missing from the universe, or if a category feels wrong, let me know and I’ll fix it.
Visit MarketStack The Edit · MarketStack Terminal
MarketStack is free today. But if you value my work, you can pledge for a future subscription. MarketStack is an independent, anonymous publication summarising publicly available commentary and views from across financial media. Nothing here constitutes financial advice or a recommendation to buy, sell or hold any security. All views are a synthesis of public information. Past performance is not a guide to future results. This publication is not authorised or regulated by the Financial Conduct Authority. The author writes anonymously in a personal capacity.